Top 3 Price Prediction Bitcoin, Ethereum, Ripple: Bulls need to sweat out phase in the disinflationary process
- Bitcoin price tanked Thursday as price action clings on a quick rebound.
- Ethereum price sees bulls stepping in and not letting bears erase their hard-earned profit.
- XRP price is underpinned as bulls eagerly buy into the price action for a quick swing higher.

Bitcoin price, Ethereum and other cryptocurrencies got a cold shower on Thursday over some very strong Producer Price Index numbers. Not only were the recent numbers higher, but the previous numbers were revised upwards as well. This means that the situation in terms of inflation is not so rosy at all, but markets must not forget that US Fed Chair Jerome Powell warned that the actual impact of what the Fed is doing could be seen filtering through with a delayed effect.
Bitcoin price will pop back up above $23,880 to continue its rally for this week
Bitcoin (BTC) price had a bit of a gut punch on Thursday, but price action kept the losses quite contained. The risk of a bigger fade to the downside was expected, seeing as US Dollar strength was what pushed US equities to the downside. With the PPI numbers higher, bulls need to think ahead since the Federal Reserve warned this could happen.
BTC needs to see bulls refocus on the element that the Fed has already hiked quite substantially, and the smaller increments now point to the fact that the Fed is nearing its endpoint. This means good news for the markets as market conditions will start to ease with inflation coming back down again. Once Bitcoin bulls realize this, expect to see BTC pop back above $23,878 and try to head for $26,000 over the weekend when tail risk submerges.
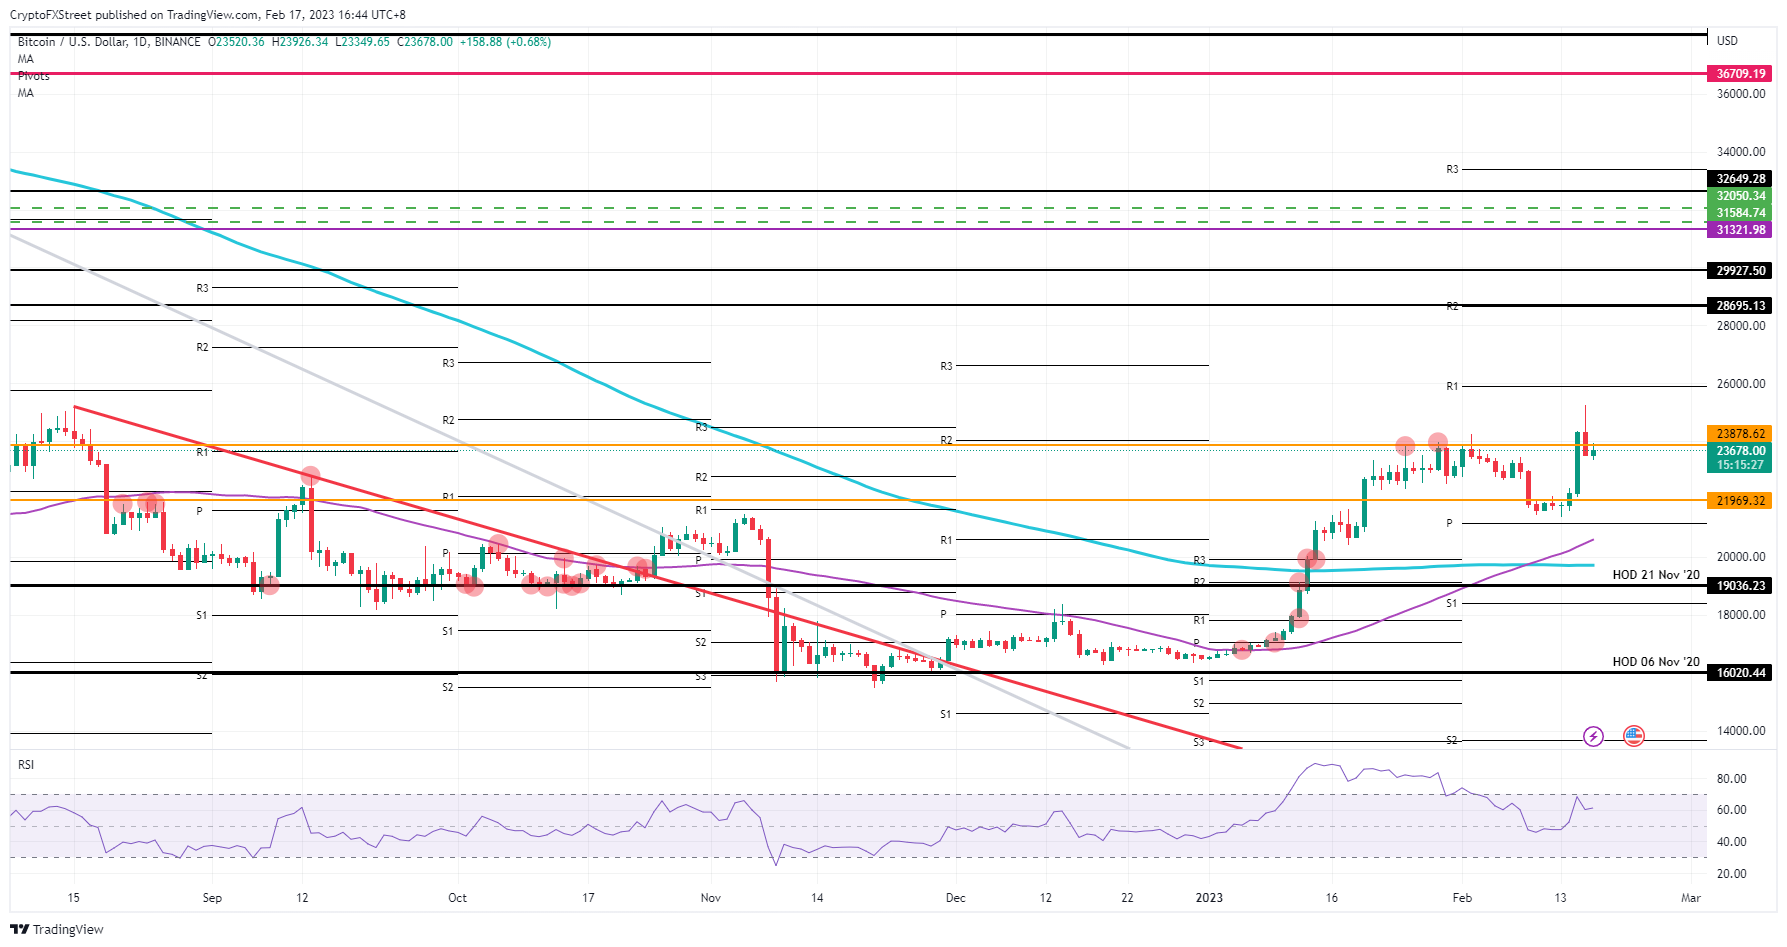
BTC/USD daily chart
Risk currently hangs in the balance with the possibility of a rejection on the top side and a dead-cat-bounce in the making. If that happens, expect to see further losses emerge with $21,969 coming into play for support. If that does not work, just below there the monthly pivot could be the cushion for a soft landing of this correction.
Ethereum price simply undergoes a hiccup and is still focused on $1,800 toward Sunday
Ethereum price (ETH) only saw a minor 2% decline being written in the quote books as bulls were unable to maintain price action above $1,688 over the US PPI numbers. With the numbers out of the way, several economists are signaling that the US economy is hitting a tipping point as several confidence numbers are starting to point to very negative, contractionary outcomes. This means that the Fed's measures will start to kick in with a delayed effect.
ETH will rise quickly out of its ashes and pierce through $1,688 again toward where it was trading on Thursday. Going into the weekend, expect bulls to buy across the board in risk assets with equities and cryptocurrency on the front foot near the US closing bell this Friday evening. During the weekend, bulls should not have any hurdle to jack prices in ETH up toward $1,928.
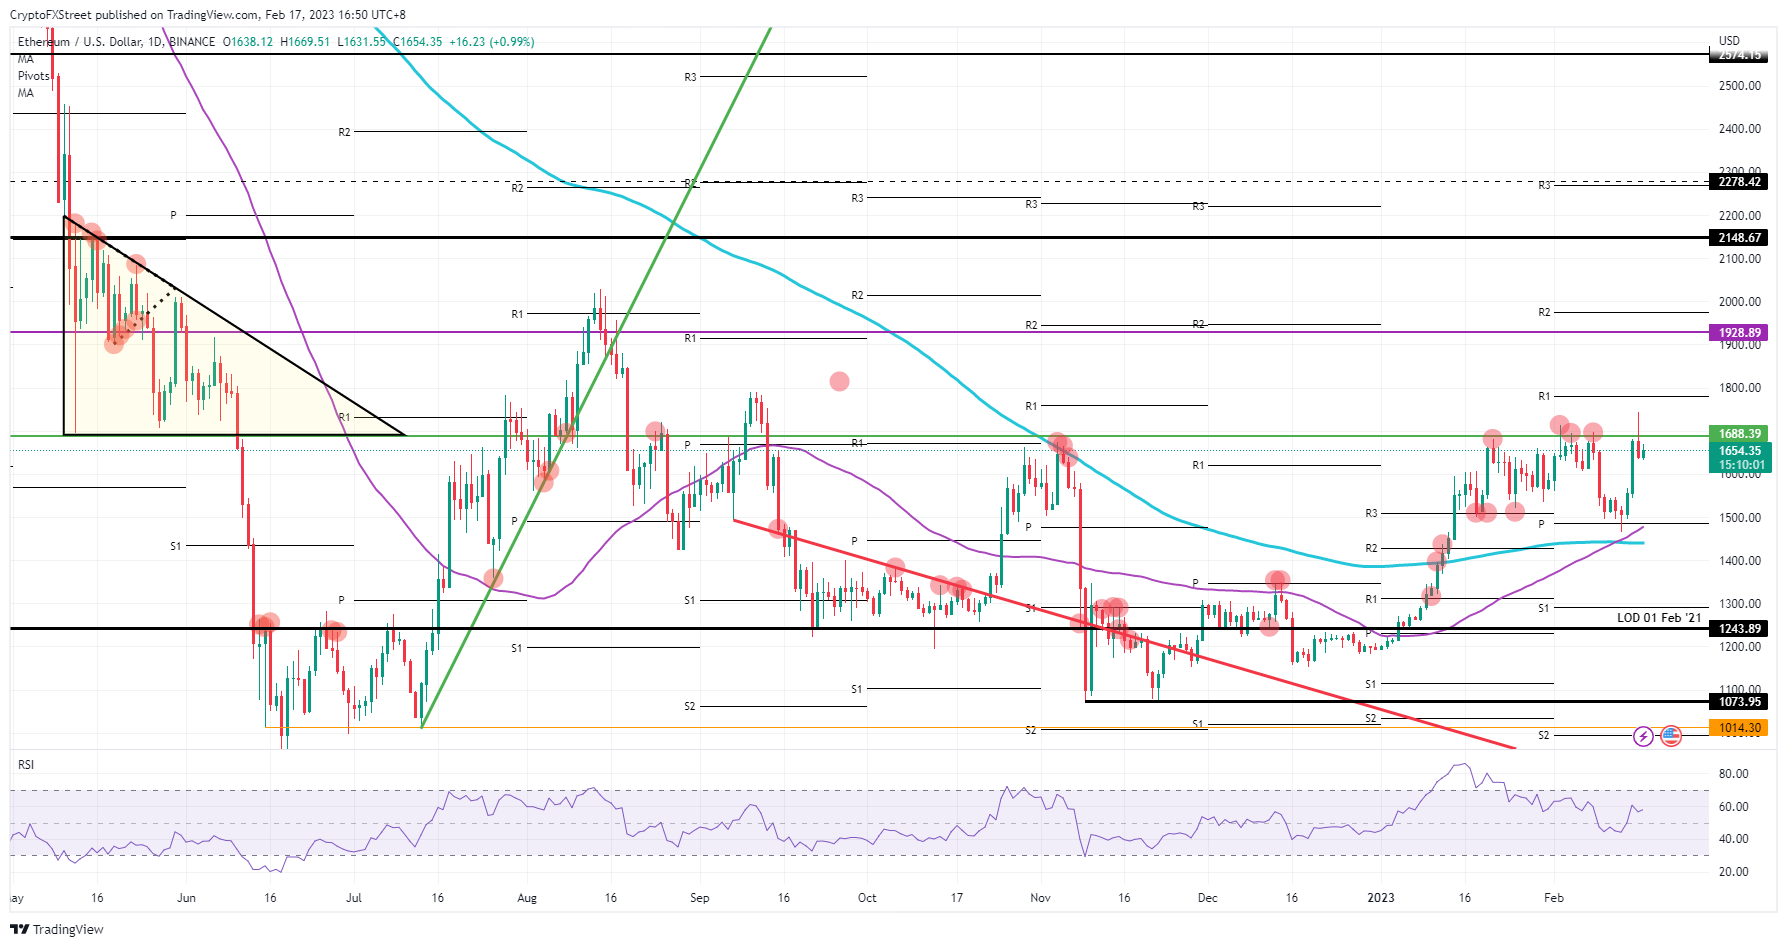
ETH/USD daily chart
The biggest risk comes with the US session, which could ad another selling round in the market. Expect bulls to get out of the way and see ETH tank toward $1,500. Luckily, plenty of support is to be found with the monthly pivot and the 55-day Simple Moving Average (SMA) lining up.
XRP price on course for $0.48 by the end of February with 25% gain on the table
Ripple (XRP) price saw a big drop of over 4% on the back of the US PPI numbers and US Dollar strength on Thursday. Ripple price shows good signs of price action being well underpinned as bulls already halted the correction even before it touched the 55-day SMA near $0.38. A few cents below, the monthly pivot was the insurance just in case the 55-day SMA could not hold.
XRP now sees bulls coming in as the risk appetite diverges between asset classes. While European equities sell-off and US futures point to red opening numbers, cryptocurrencies are tying up with green numbers. This shows the bullish appetite in XRP that will see $0.42 being broken to the upside over the weekend.
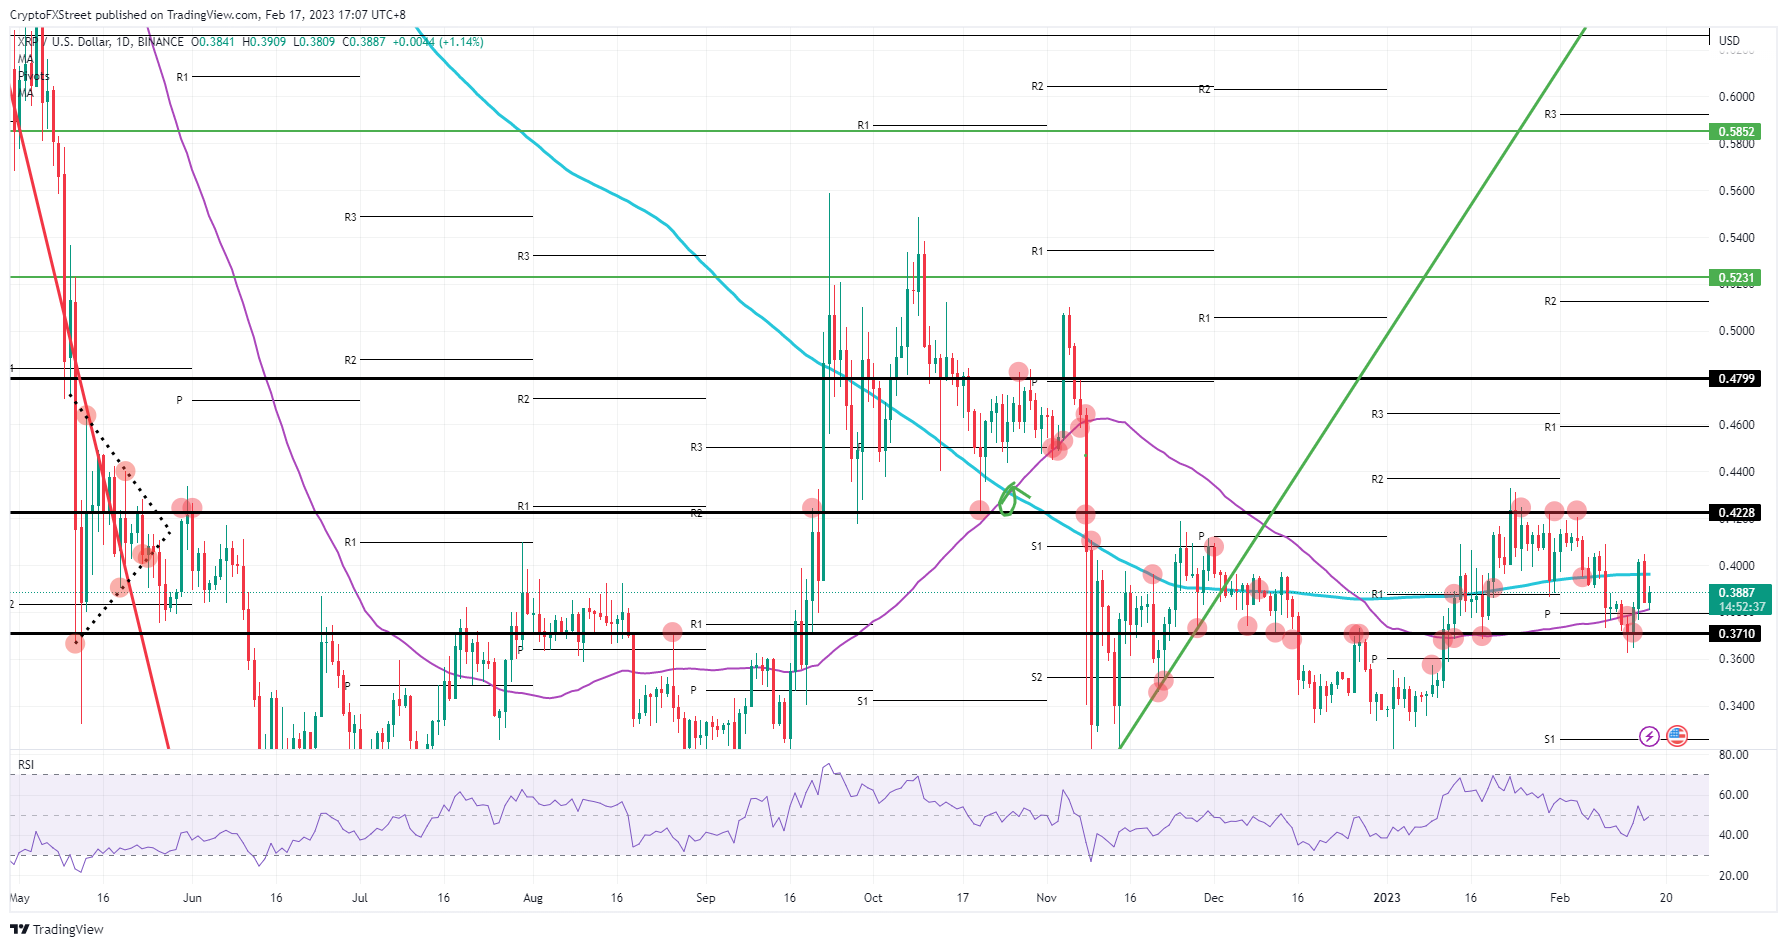
XRP/USD daily chart
Risk elements for today look to be small as traders will rather focus on US GDP and European inflation data. Should the new numbers next week further support the concept that inflation is sticky or even crunching higher, that would mean that markets are wrong-footed. Expect the rally to be priced out again if that is the story and see XRP dipping below $0.37 with at risk a full 7-cent drop toward $0.30.
Author

Filip Lagaart
FXStreet
Filip Lagaart is a former sales/trader with over 15 years of financial markets expertise under its belt.


