Bitcoin Weekly Forecast: If BTC bear market ends, $43,000 is the next target for bulls
- Bitcoin price shows signs of embarking on a bull run, but it needs to fulfill a few conditions.
- BTC’s CME chart shows unfilled gaps at $35,180, making it one of the bull rally's targets.
- The ongoing bullish trend will face invalidation if the big crypto fails to defend the $21,867.

Bitcoin price shows a clean bounce off a stable support level that paused its retracement and restarted its 2023 bull rally. While the recovery was impressive, it faced massive selling pressure as it approached the 200-day Simple Moving Average (SMA). Regardless, the big crypto’s position looks strong and optimistic as it consolidates.
Also read: US CPI data above expectations at 6.4% – Is the crypto market about to turn bearish?
Bitcoin price ready to cover more ground
Bitcoin price bounced off the $21,867 support level, ending the short-lived correction. The weekly chart currently shows two critical levels - the 200-day SMA at $25,009, roughly coinciding with the Momentum Reversal Indicator’s resistance level at $25,207 and the aforementioned support level.
If neither of the camps fails to take control of the Bitcoin price, a consolidation similar to the second half of December 22 is likely to ensue.
Further inspecting the Relative Strength Index (RSI) shows that it has bounced off the 50-level, indicating a potential replenishment of bullish momentum.
Therefore, the 2023 bull rally, which has yielded a 43% upswing, could continue, pushing Bitcoin price higher. In a case where BTC overcomes the resistance confluence at roughly $25,200, the next stop would be $43,000, as indicated by the MRI.
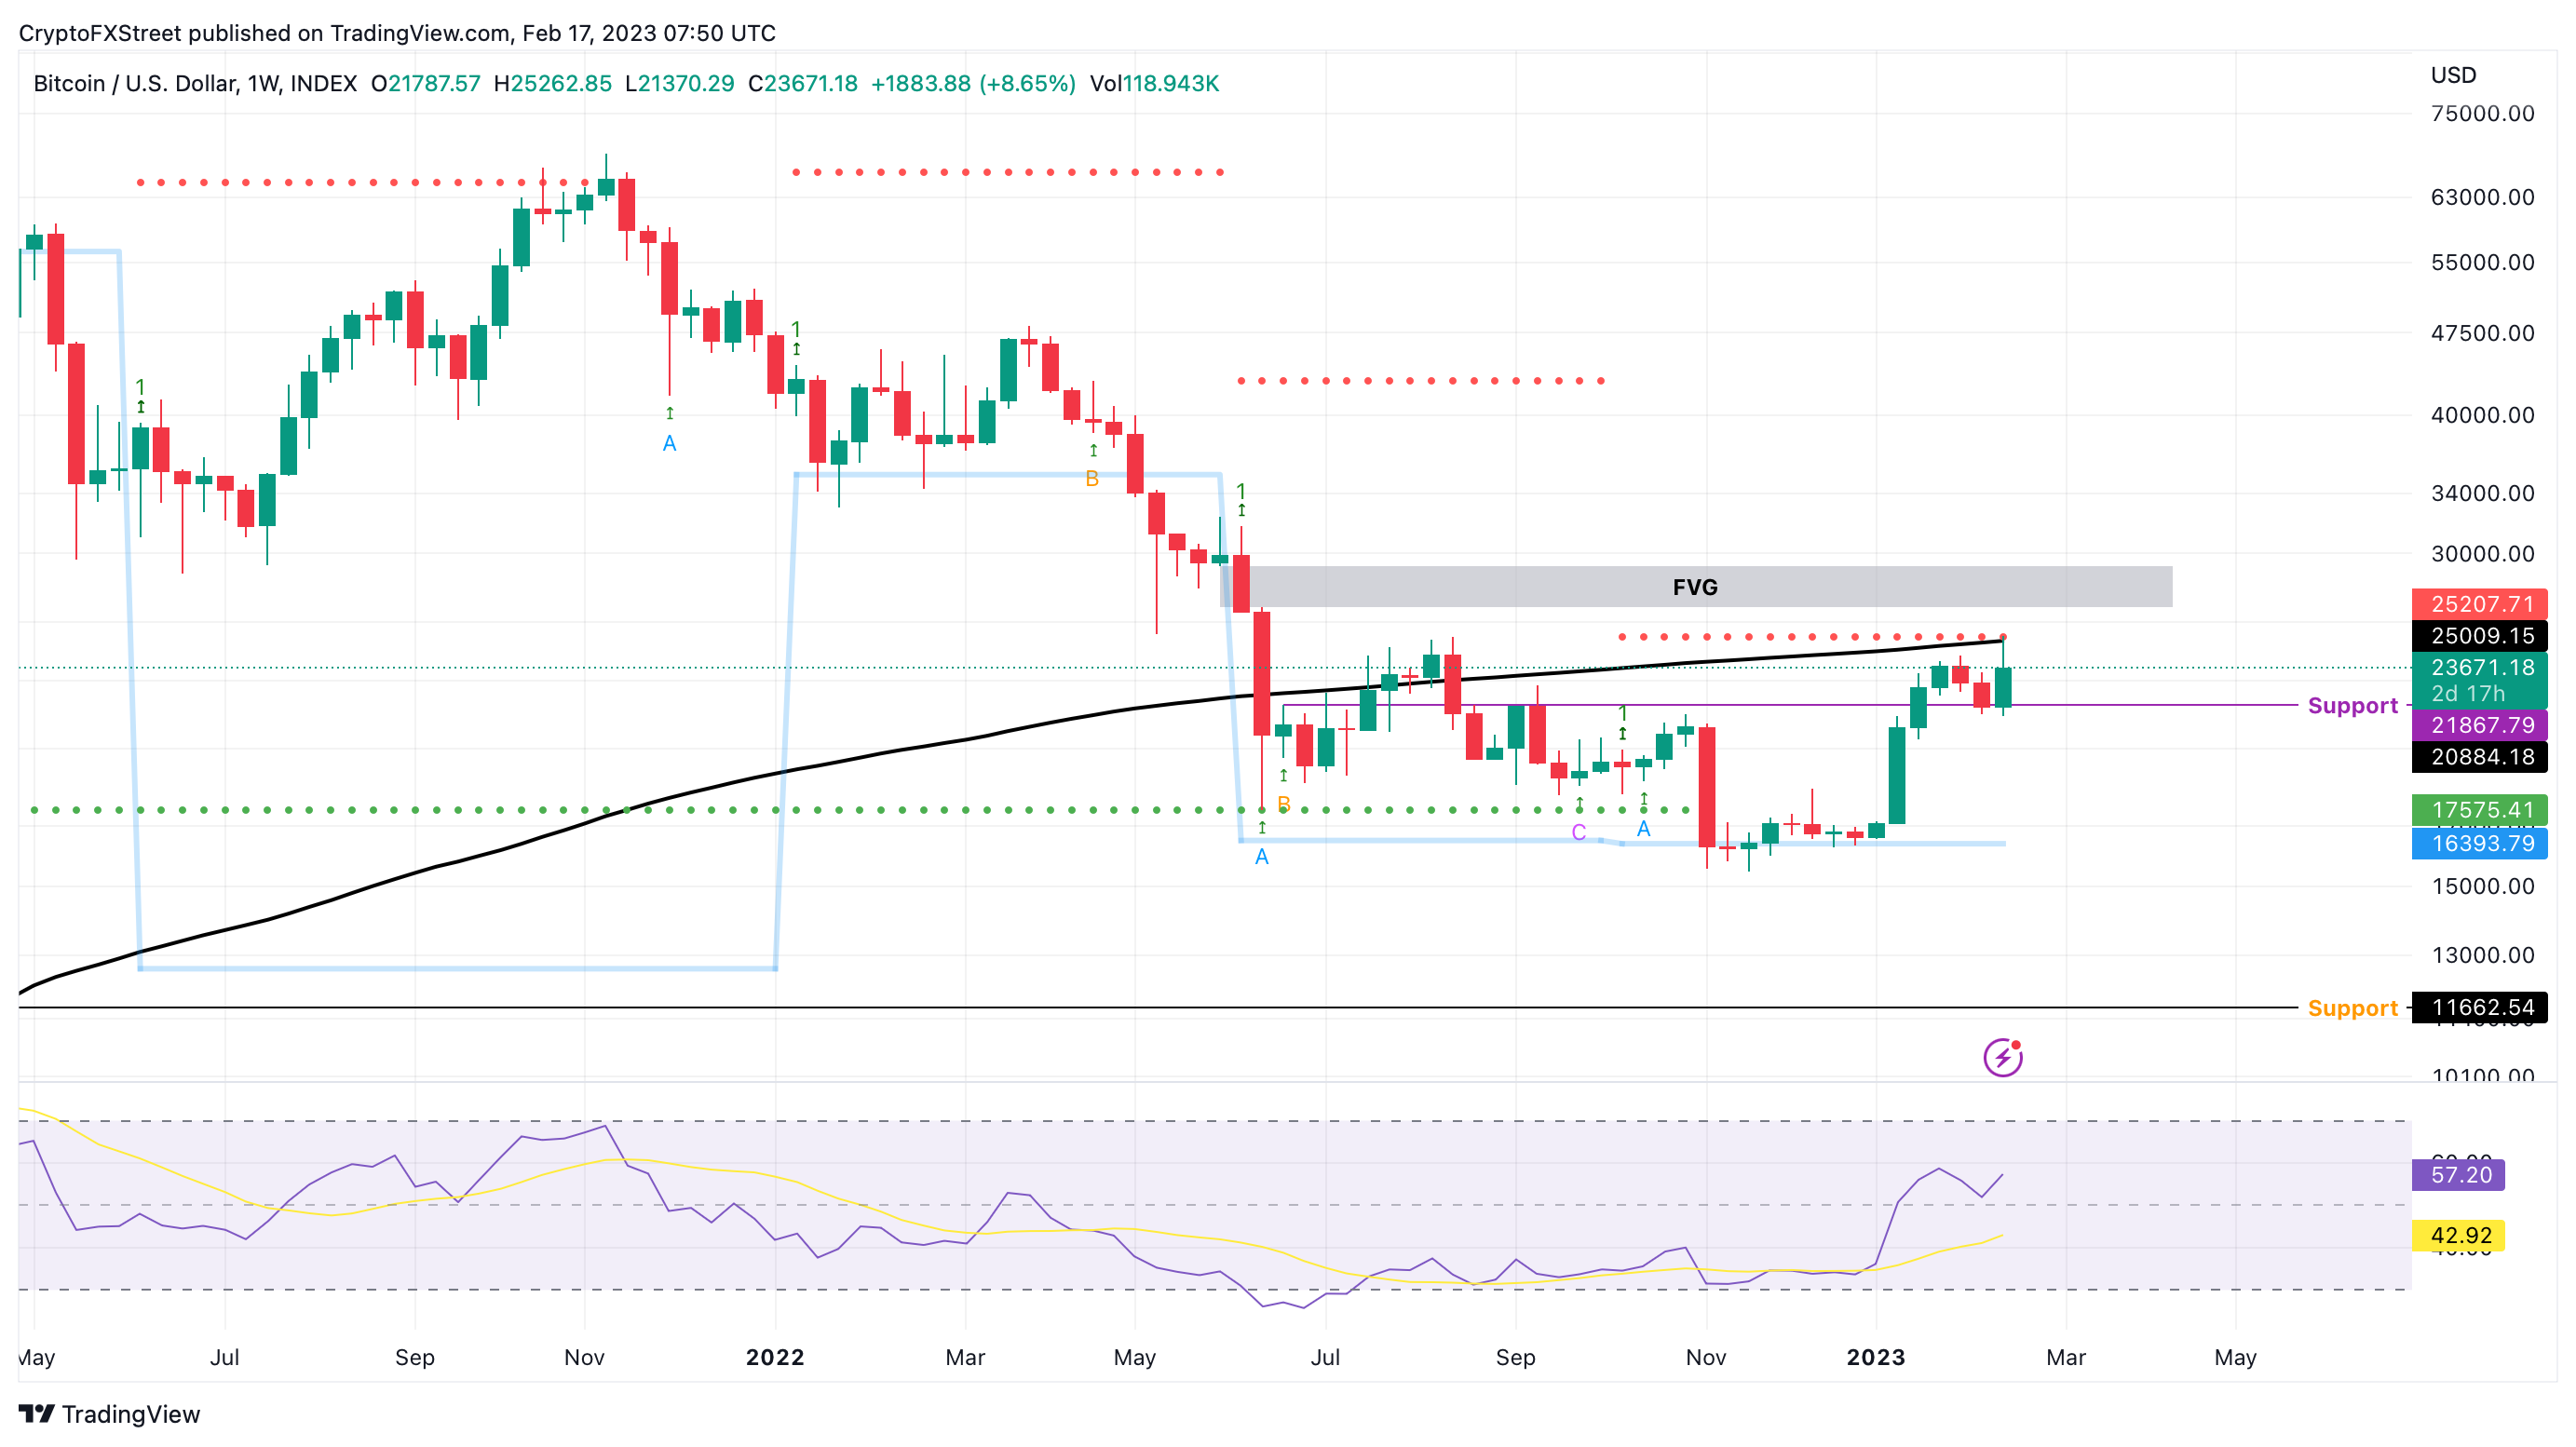
BTC/USDT 1-week chart
The three-day chart for Bitcoin price shows the same picture but with a slightly different view. The 2023 bull rally propelled the largest crypto by 48%, from $16,358 to $24,267. BTC attempted to breach this level after bouncing off the bullish breaker, as seen in the chart below. However, the momentum waned after sweeping the range high at $24,267 and tagging the $25,234 hurdle.
As noted in a previous article, a bullish breaker formation is formed after a supply zone formed between two key lower lows in a downtrend is flipped after a swift impulsive up move. If the above conditions are met, a retest of this newly formed bullish breaker usually results in a spike in buying pressure.
BTC’s downtrend around the US CPI announcement on February 5 tagged this bullish breaker’s upper limit at $21,470, which led to a surge in buying pressure. As a result, BTC climbed 18% in under 72 hours.
Unlike the weekly chart, which forecasts a bullish target of $43,000, the MRI indicator on the three-day chart predicts a much more palpable target of $30,700.
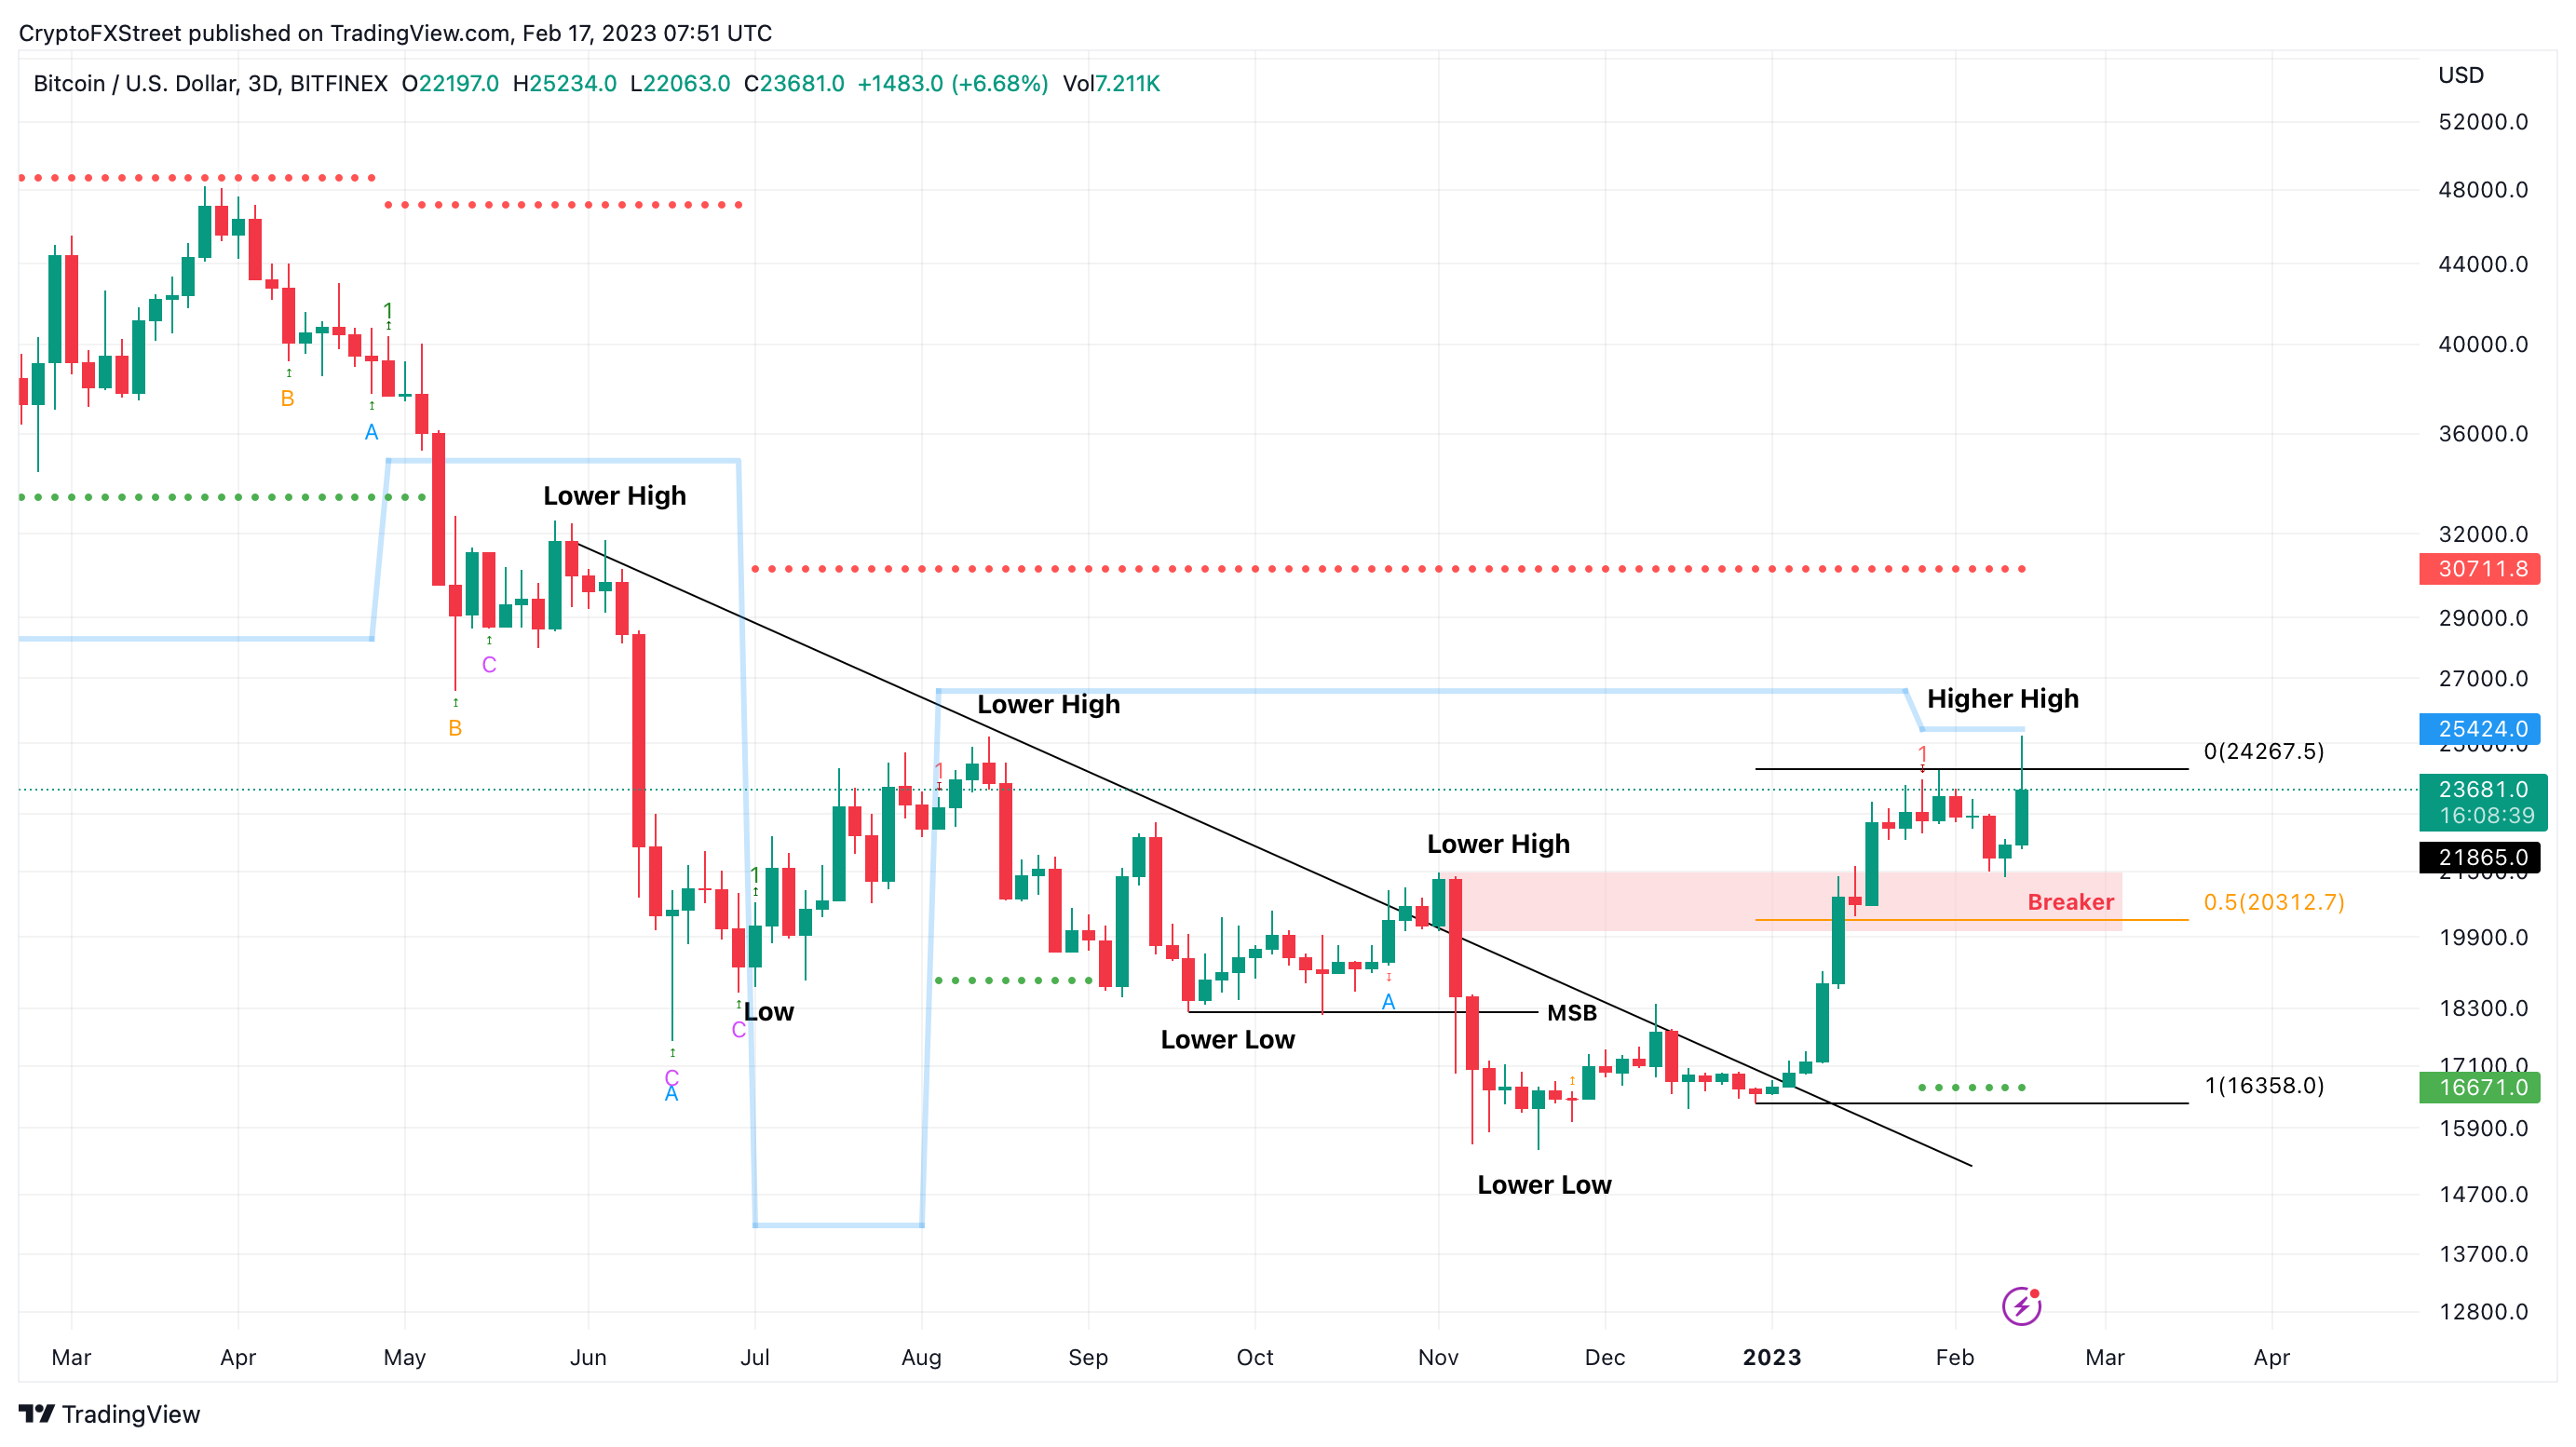
BTC/USDT 3-day chart
IntoTheBlock’s Global In/Out of the Money (GIOM) model shows that the immediate resistance cluster of underwater investors is thin. The next significant hurdle comes in at $30,766, which coincides with the targets seen on the three-day chart.
Here, 1.95 million addresses that purchased nearly 995,000 BTC are currently “Out of the Money.” Therefore, a move into this area could cause these holders to offload their holdings to break even, resisting the uptrend.
Hence, the possibility of a local top formation at $30,000 is high. The next cluster, as seen in the chart below, is around $40,000, where roughly 4.7 million addresses that bought nearly 2.1 million BTC are also underwater.
In case BTC overcomes the $30,000 psychological level, the next critical hurdle to book profits would be $40,000.
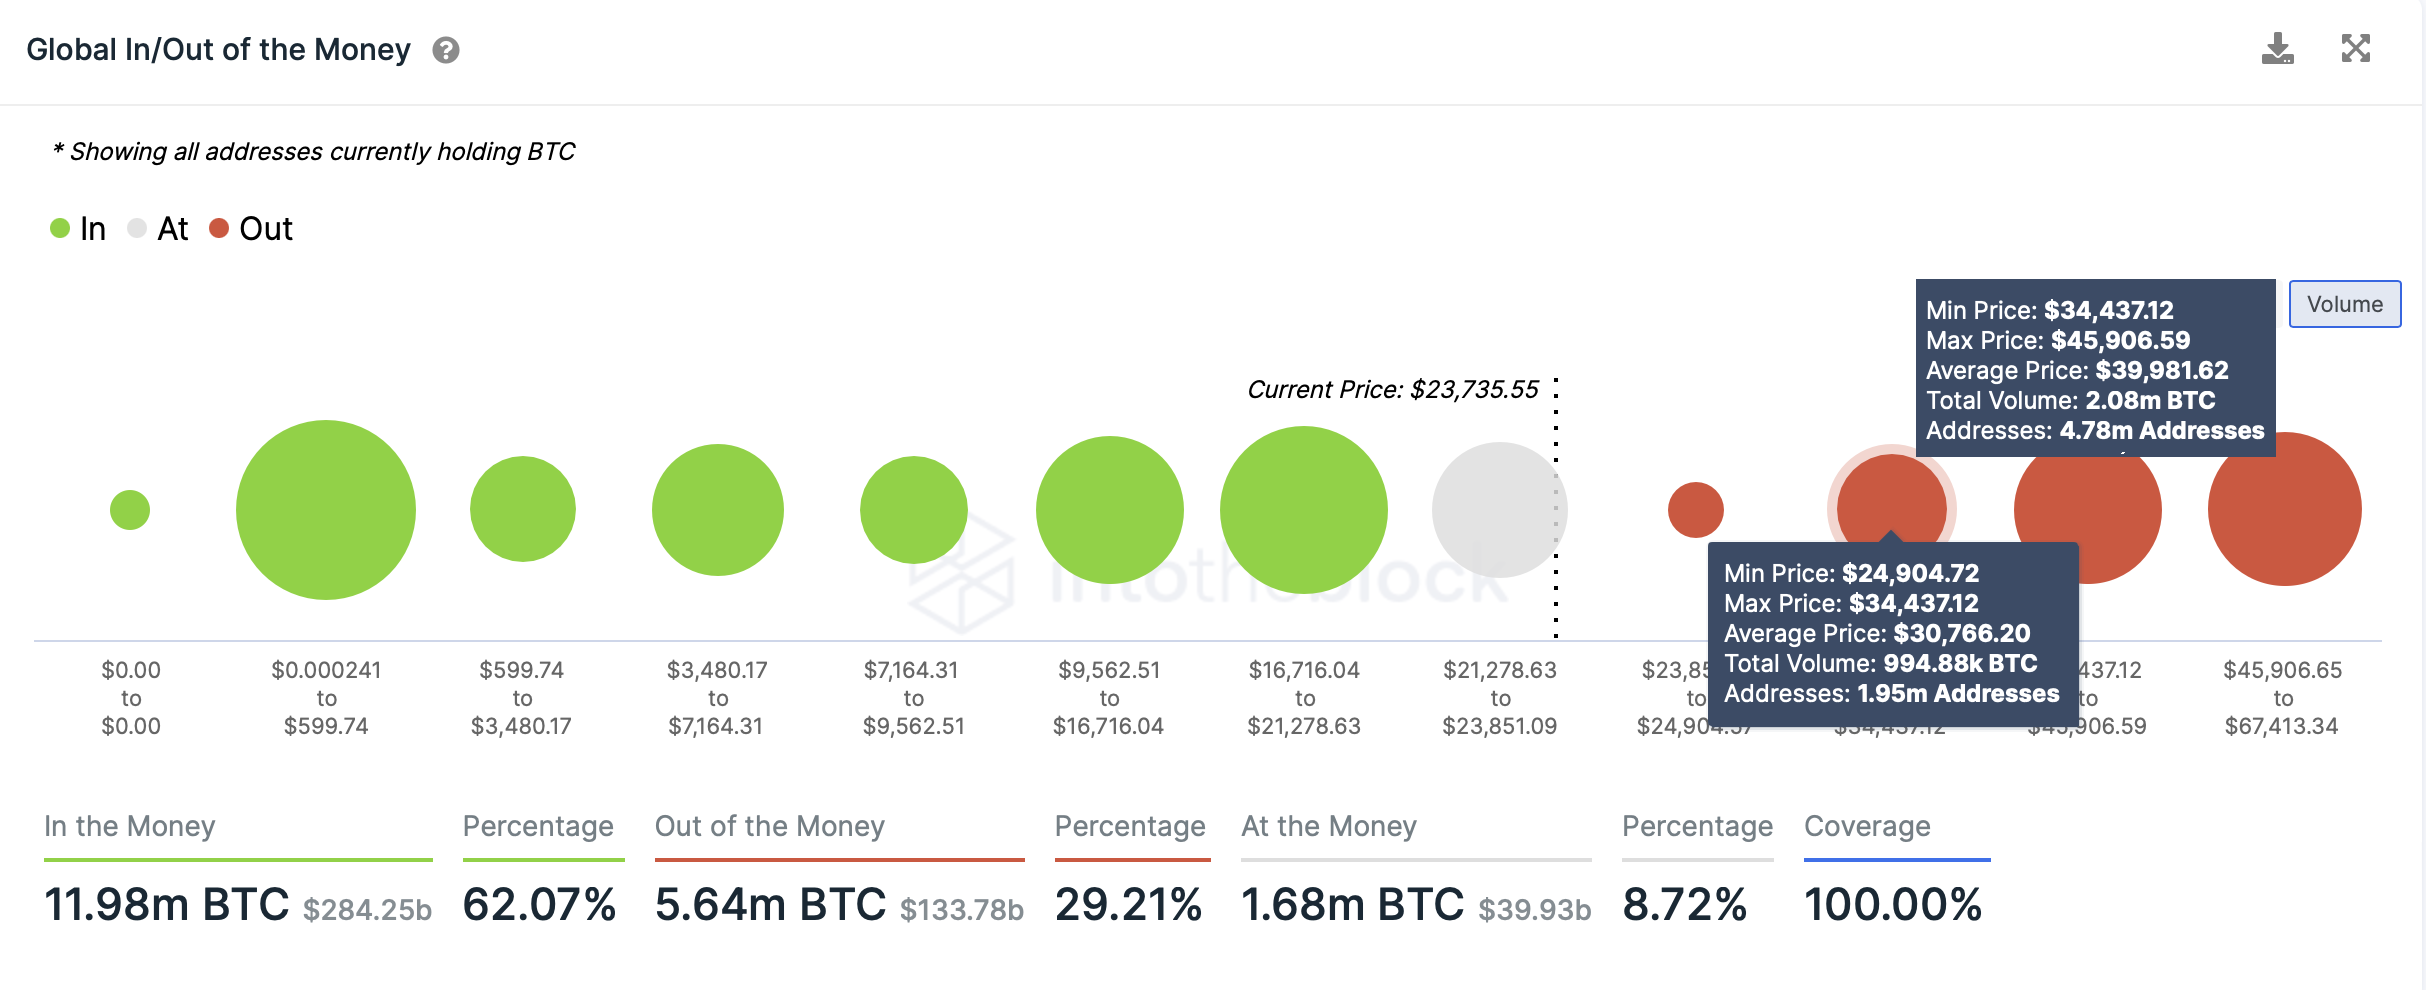
BTC GIOM
Network data sheds cautiously bullish signs
While the long-term outlook of Bitcoin price looks relatively safe, in the short-term, market participants, especially whales, seem to be booking profits after a retest of the $25,000 psychological level.
The Whale Transaction metric, which tracks transactions of investors worth $1 million or more, showed a spike after BTC rallied on February 16.
This uptick serves as a proxy for these high-net-worth individuals likely moving their holdings to book profits. Hence, such moves in the on-chain metrics are often used to identify local top formations.
 [15.01.17, 17 Feb, 2023]-638122285117197067.png)
Whale transactions
If this outlook persists and investors continue to realize gains, the selling pressure could cause a trend reversal.
The ensuing snowball effect could push Bitcoin price to produce a daily candlestick close below $21,867, thus creating a lower low and invalidating the bullish thesis.
Such a move would be fatal for bulls and trigger panic selling, driving the pioneer crypto down to $17,575, which is the next stable support level. A breakdown of this barrier could send BTC to test the $16,393 floor.
Author

Akash Girimath
FXStreet
Akash Girimath is a Mechanical Engineer interested in the chaos of the financial markets. Trying to make sense of this convoluted yet fascinating space, he switched his engineering job to become a crypto reporter and analyst.


