Ethereum Classic price sets for a rally following retest of key support
- Ethereum Classic price retests the support area between $20.89 and $21.63, with an impending rally eyed.
- On-chain data shows ETC's increasing account growth, suggesting a bullish move ahead.
- A daily candlestick close below $19.27 would invalidate the bullish move.

Ethereum Classic (ETC) edges higher by 2.3% and trades around $22.60 at the time of writing on Friday after testing a key support area the day before. On-chain data showing increased account growth suggests a bullish move ahead.
Ethereum Classic looks promising
Ethereum Classic price faced rejection by the daily resistance level of $25.13 earlier this week. It declined 8% in the next two days to test its support area between $20.89 and $21.63 on Thursday. At the time of writing, it bounces 2.3% higher and trades around $22.60 on Friday.
If this support area between $20.89 and $21.63 holds, ETC could rally 12% from the current price to retest its daily resistance at $25.13.
The Relative Strength Index (RSI) on the daily chart has briefly slipped below the neutral level of 50, while the Awesome Oscillator (AO) is on its way to doing the same. If bulls are indeed making a comeback, then both momentum indicators must regain their positions above their respective mean levels. Such a development would add a tailwind to the recovery rally.
If bullish sentiment prevails and the overall cryptocurrency market outlook remains optimistic, Ethereum Classic price could close above the $25.13 mark, potentially continuing its rally by 12% to challenge its 61.8% Fibonacci retracement level (plotted from the May 23 high of $34.35 to the July 5 low of $18.19) at $28.17.
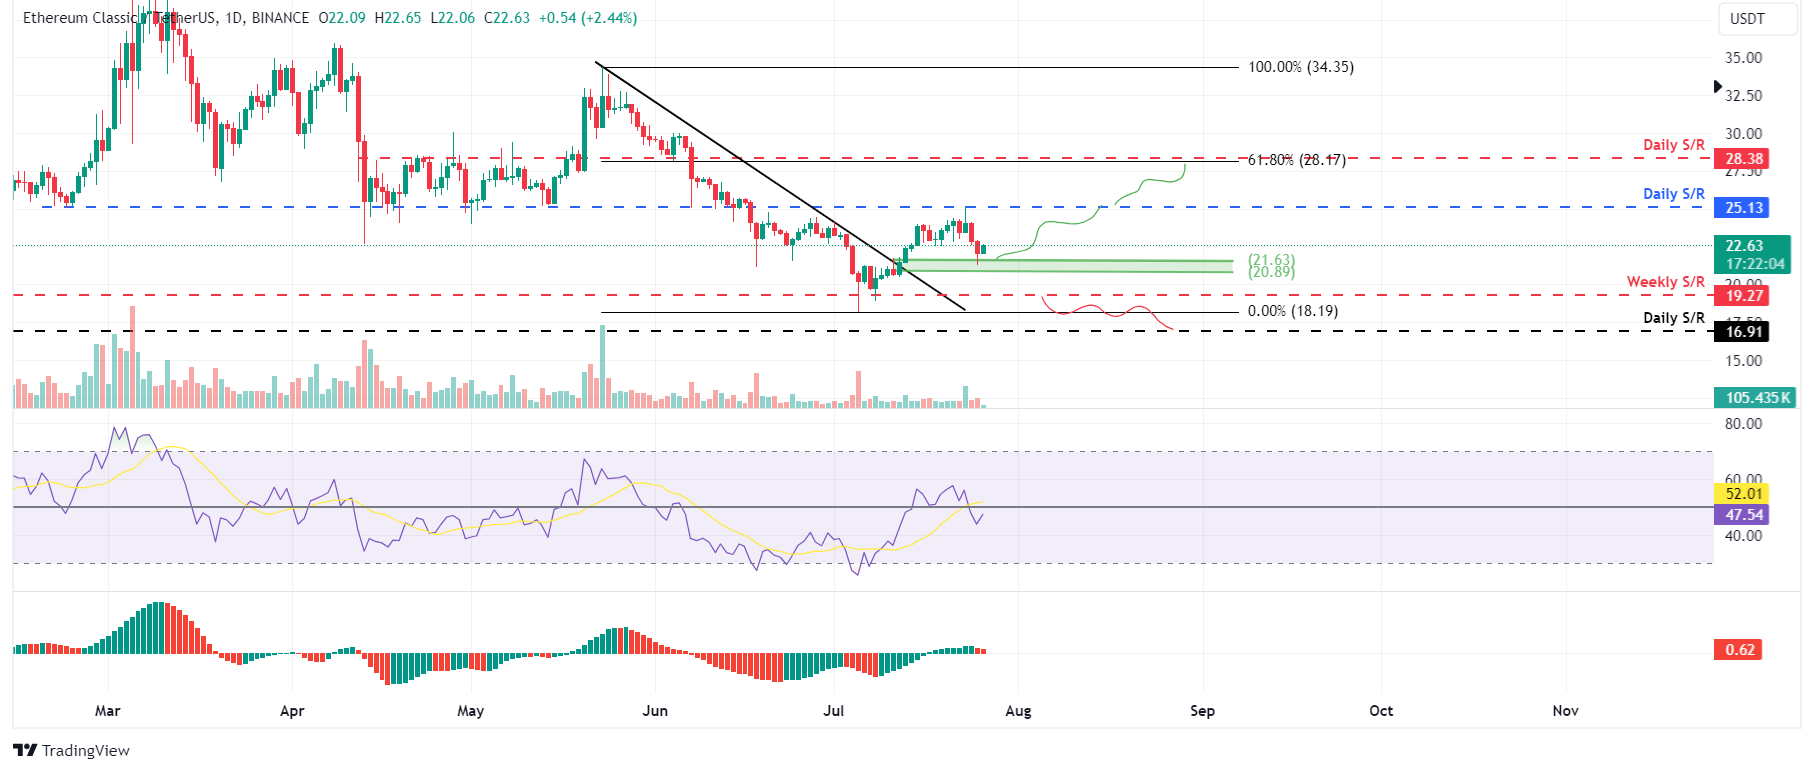
ETC/USDT daily chart
According to Ethereum Classic Explorer (Accounts growth chart shown below ), ETC account growth increased from 9.49 million in late May to 9.61 million in late July. An increase in account numbers typically signals growing interest in and adoption of the Ethereum Classic network.
-638575837307112242.png)
ETC Accounts growth
Additionally, Coinglass's Long-to-Short ratio shows insight into traders' and investors' sentiment toward a specific cryptocurrency. A high long-to-short ratio suggests that more traders are betting on the coin's price increasing (bullish sentiment). In contrast, a low ratio indicates that more traders are betting on decreasing prices (bearish sentiment).
As in ETC's case, the Long-to-Short ratio is at 1.58, which suggests that approximately 1.58 times as many long positions are open as short positions, signaling a bullish sentiment by ETC investors.
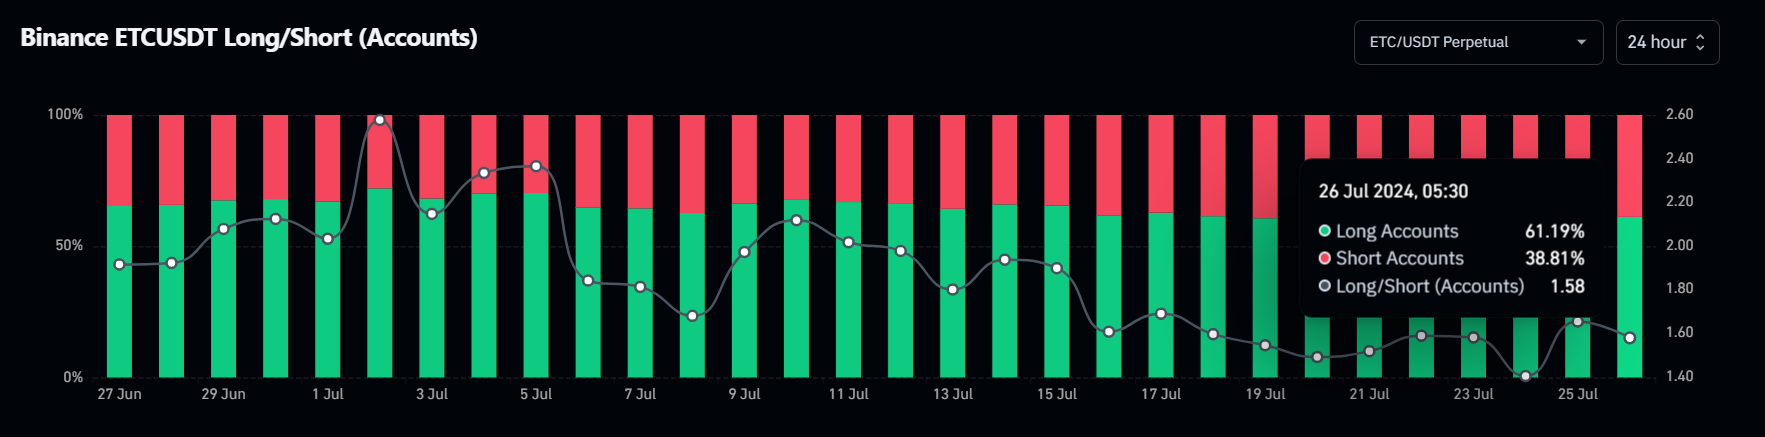
ETC Long/Short ratio chart
Even though the on-chain metric and technical analysis point to a bullish outlook, if ETC's daily candlestick closes below $19.27, the bullish thesis would be invalidated by producing a lower low on a daily timeframe. This development could see the Ethereum Classic price crash by 12% to the daily support level of $16.91.
Author

Manish Chhetri
FXStreet
Manish Chhetri is a crypto specialist with over four years of experience in the cryptocurrency industry.



