Price analysis 2/13: SPX, DXY, BTC, ETH, BNB, XRP, DOGE, ADA, MATIC, SOL

Bitcoin and major altcoins look vulnerable to a deeper correction after the crackdown on Paxos soured sentiment across the crypto market.
Bitcoin and select altcoins are threatening to deepen their correction after reports emerged that the United States Securities and Exchange Commission (SEC) issued a Wells Notice to Paxos, alleging that the dollar-pegged Binance USD stablecoin is an unregistered security. Separately, Paxos has been ordered by the New York Department of Financial Services (NYDFS) to halt the issuance of BUSD.
After the crackdown on Kraken last week and now Paxos, the regulator’s actions may increase nervousness among crypto investors. FOX Business journalist Eleanor Terrett tweeted on Feb. 12 that “more Wells notices going out in the coming 2-3 weeks, I’m told.”
Daily cryptocurrency market performance. Source: Coin360
Volatility may remain high in the near term as market observers await the consumer price index data to be released on Feb. 14. Interestingly, Bitcoin has made a golden cross on the daily chart and a death cross on the weekly time frame.
This suggests that the medium-term trend remains negative but the short-term trend could be signaling a turnaround. Let’s study the charts to find out the critical support and resistance levels to watch out for.
SPX
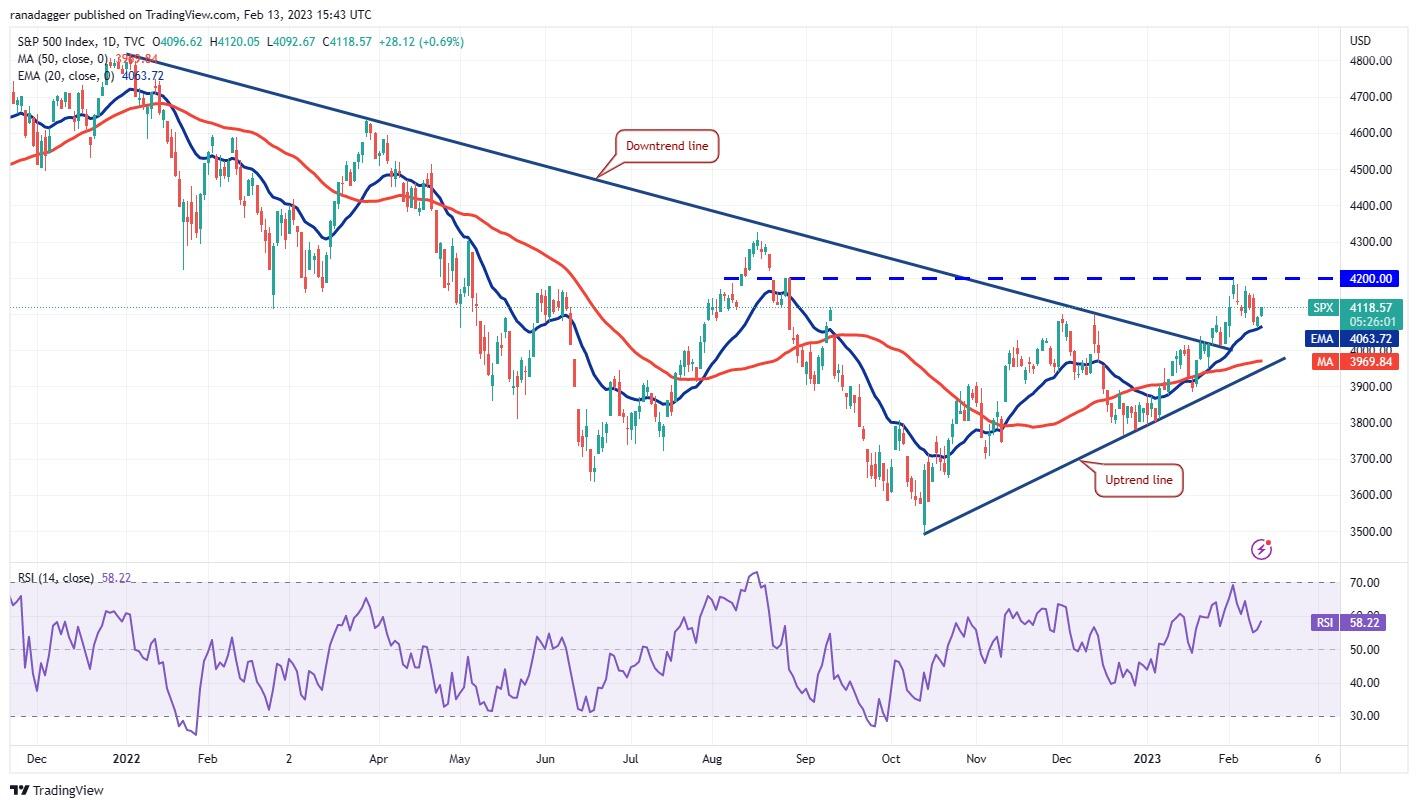
The S&P 500 index (SPX) turned down from 4,200 on Feb. 2 and has reached the 20-day exponential moving average (4,057) on Feb. 10. This is an important level for the bulls to defend if they want to keep the recovery intact.

SPX daily chart. Source: TradingView
The 20-day EMA is sloping up gradually and the relative strength index (RSI) is in the positive territory, indicating a minor advantage to buyers. The bulls will try to push the price to the overhead resistance at 4,200.
This is an important level to keep an eye on because if bulls pierce this resistance, the index may rally to 4,300 and thereafter to 4,500.
If bears want to have the upper hand, they will have to pull the index below the 20-day EMA. That could sink the index to the uptrend line.
DXY
The U.S. dollar index (DXY) turned down from the resistance line on Feb. 7 but the bears could not sink the price below the 20-day EMA (103). This suggests a change in sentiment from selling on rallies to buying on dips.
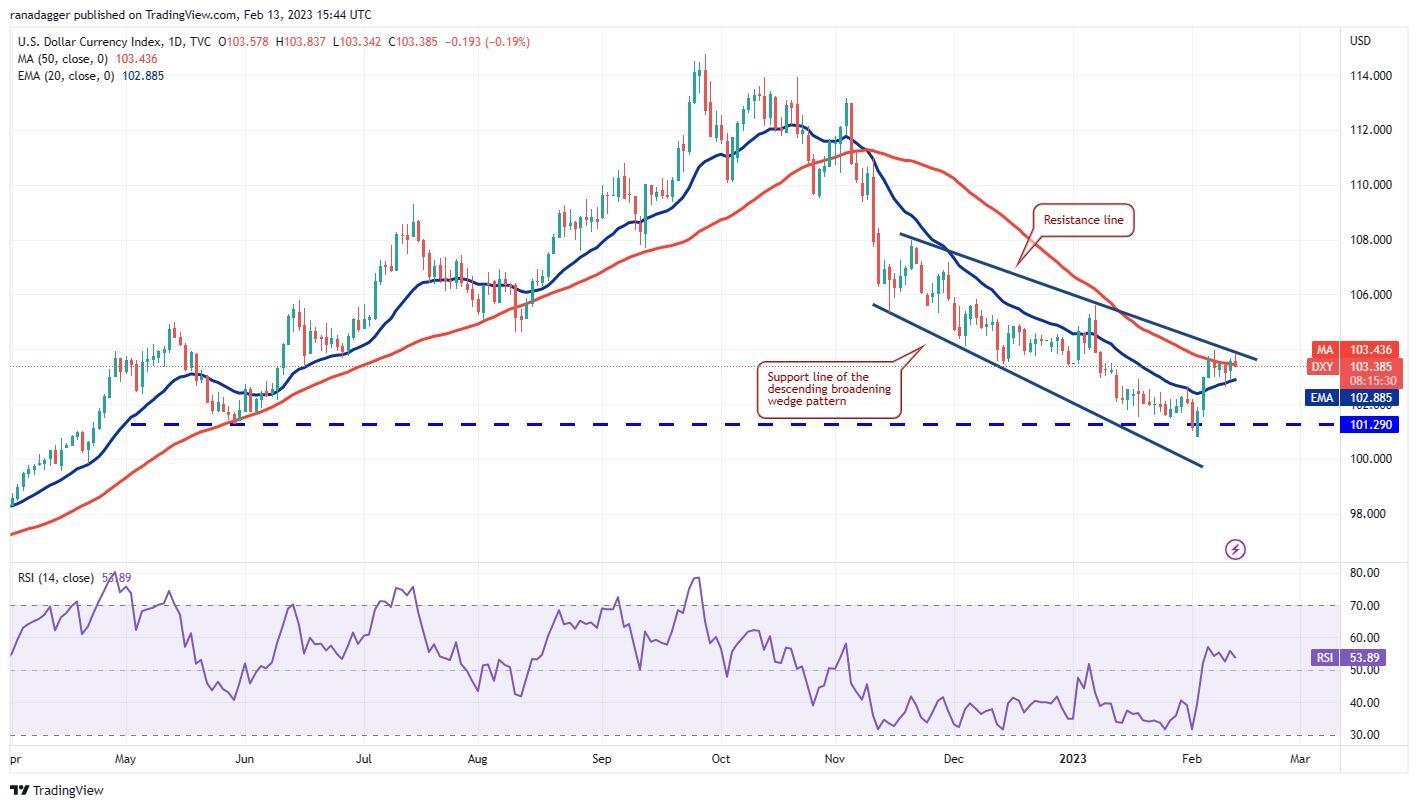
DXY daily chart. Source: TradingView
The 20-day EMA has turned up and the RSI has risen into the positive territory, suggesting that bulls are making a comeback. If the price breaks and sustains above the resistance line, the short-term trend may turn positive. The index could then start its northward march to 106 and later to 108.
Instead, if the price turns down from the current level and breaks below the 20-day EMA, it will suggest that the index may extend its stay inside the wedge pattern for a few more days.
BTC/USDT
Bitcoin’s attempt to recover fizzled out at $22,090 on Feb. 12, indicating that bears are selling on every minor rise and not waiting for the price to reach the 20-day EMA ($22,241).
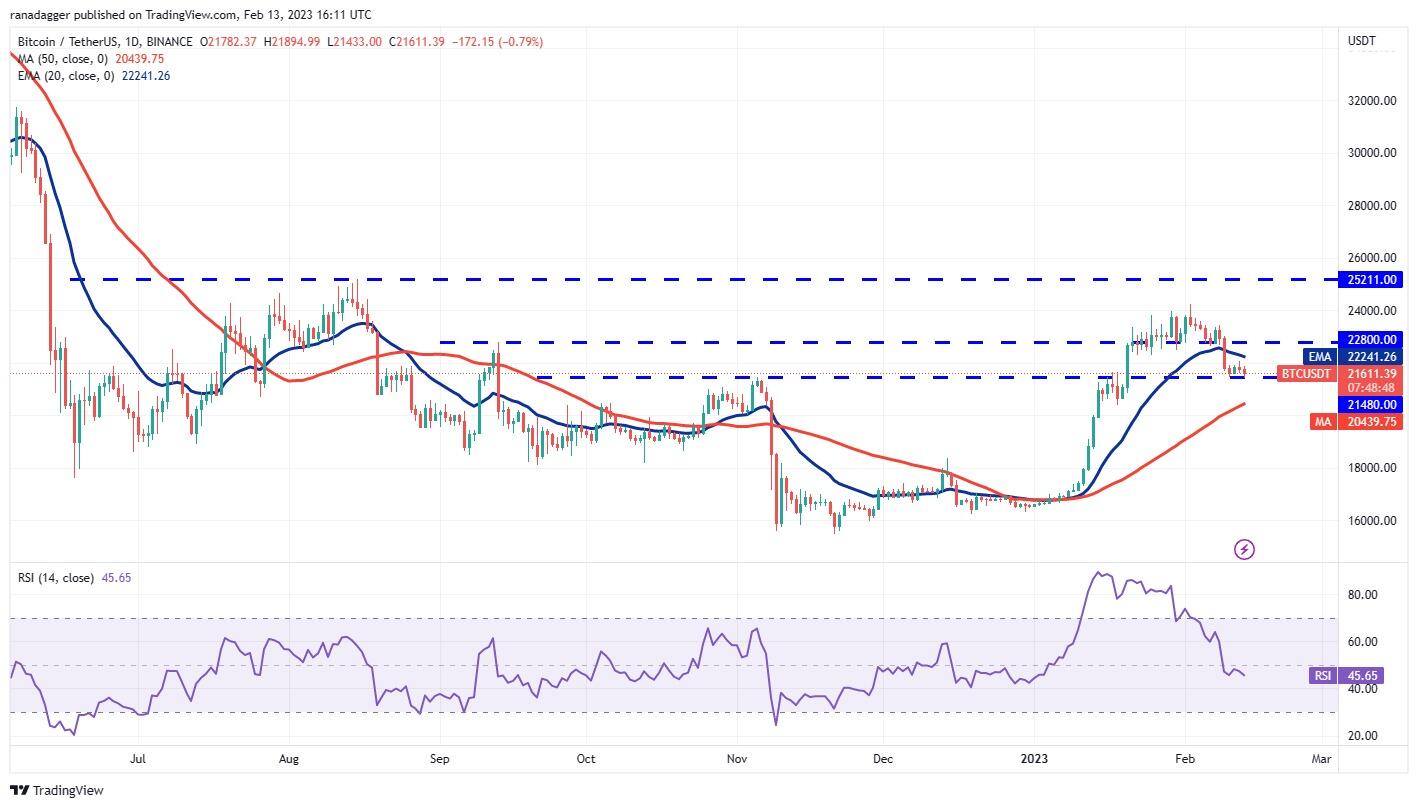
BTC/USDT daily chart. Source: TradingView
This increases the possibility of a break below $21,480. The downsloping 20-day EMA and the RSI in the negative zone indicate that the path of least resistance is to the downside. The next support is the 50-day simple moving average ($20,439).
If the price rebounds off this support, the bulls will attempt to drive the BTC/USDT pair above $21,480 and attack the 20-day EMA. Buyers will have to clear this hurdle to seize control and open the doors for a possible rally to $23,500.
ETH/USDT
Ether is struggling to find its footing at the $1,500 support. The 20-day EMA ($1,567) has turned down and the RSI is in the negative territory, indicating that bears have the upper hand.
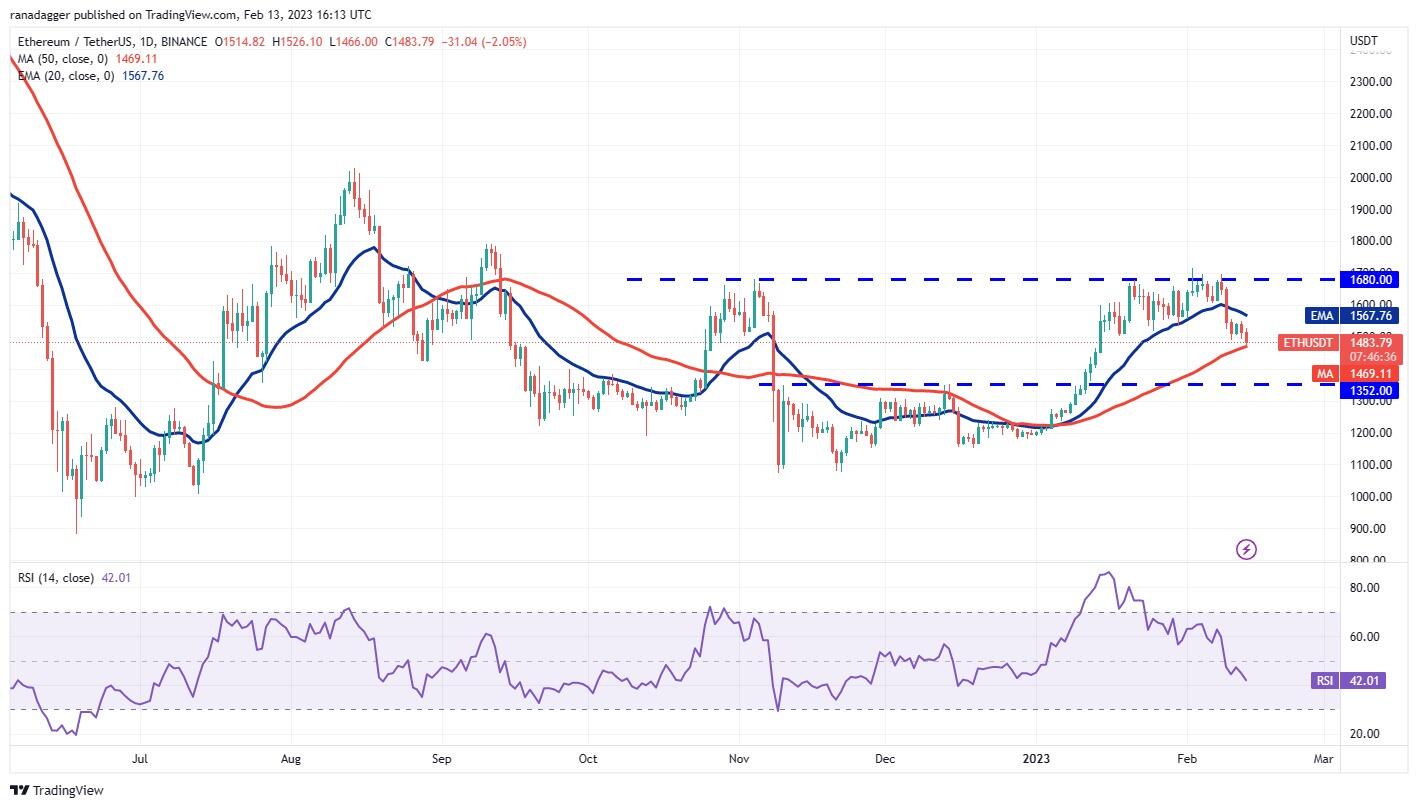
ETH/USDT daily chart. Source: TradingView
If the 50-day SMA ($1,483) fails to arrest the decline, the selling could accelerate and the ETH/USDT pair may fall to the solid support at $1,352. This level may attract aggressive buying by the bulls. If the price rebounds off it, the pair may oscillate between $1,352 and $1,680 for some time.
Another possibility is that the price turns up from the 50-day SMA and breaks above the 20-day EMA. The pair could then rally to $1,680, which remains the key level for the bulls to surmount.
BNB/USDT
BNB faced rejection at $318 on Feb. 12, suggesting that bears are selling on rallies. The bears will try to strengthen their position further by dragging the price below the strong support at $280.
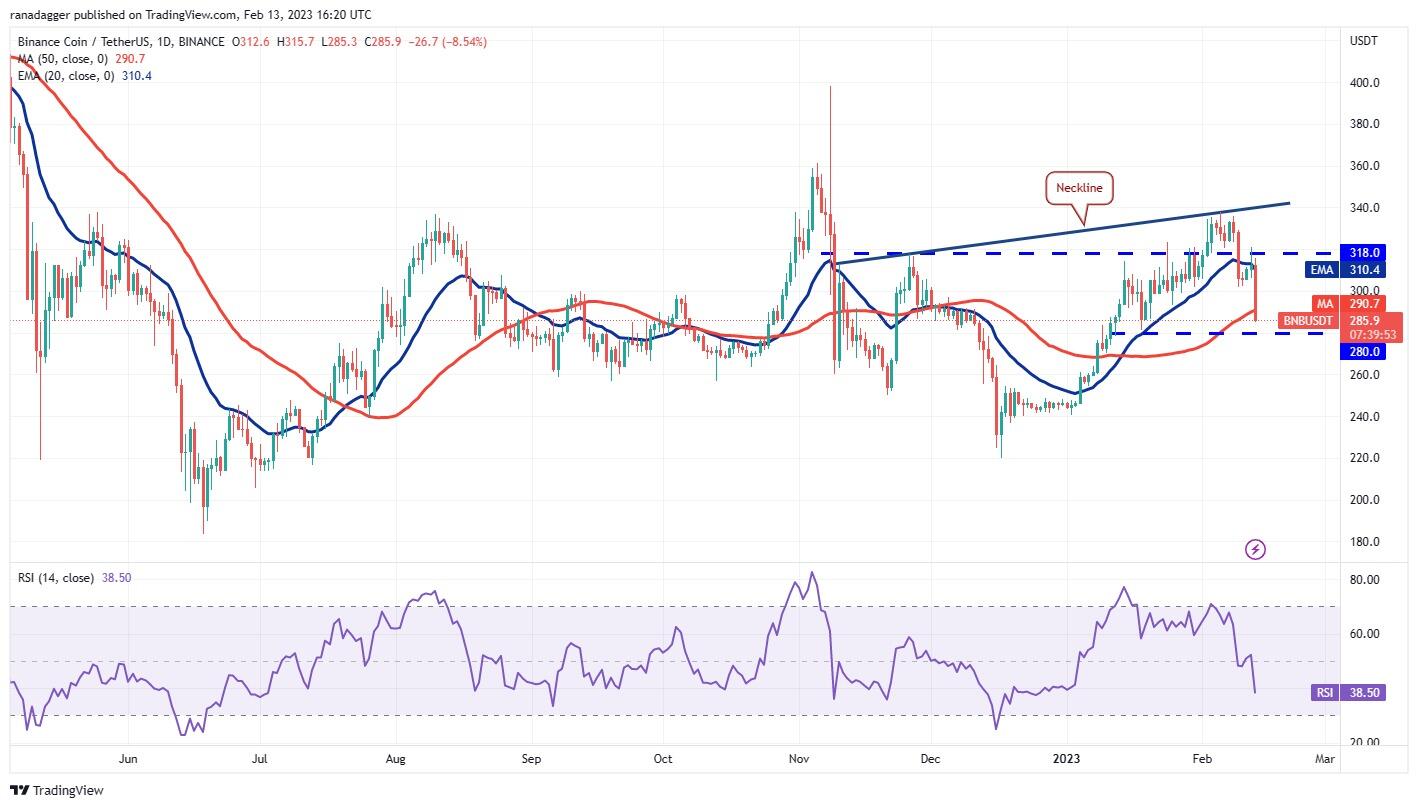
BNB/USDT daily chart. Source: TradingView
The 20-day EMA ($310) has started to turn down and the RSI is in the negative territory, indicating that bears are at an advantage. If the $280 level collapses, the BNB/USDT pair may witness aggressive selling. The next support is $250.
Conversely, if the price jumps up from $280, the bulls will again try to push the pair above $318. If they succeed, the pair could rise to the neckline of the developing inverse head and shoulders pattern.
XRP/USDT
The bulls failed to protect the 50-day SMA ($0.38), indicating a lack of demand at lower levels. XRP’s next support is at $0.36.

XRP/USDT daily chart. Source: TradingView
The 20-day EMA ($0.39) has started to turn down and the RSI has slipped into the negative territory, indicating that bears have the edge.
Even if the price rebounds off $0.36, the bears will try to sell on rallies to the 20-day EMA. If the price turns down from this level, it will increase the likelihood of a break below $0.36. The XRP/USDT pair could then plunge to $0.33.
Alternatively, if the price turns up and rises above the 20-day EMA, the pair may remain stuck between $0.36 and $0.43 for a while longer.
DOGE/USDT
Dogecoin is witnessing a tough battle between the bulls and the bears near the moving averages. A minor positive is that the bulls have not allowed the price to sustain below the 50-day SMA ($0.08).
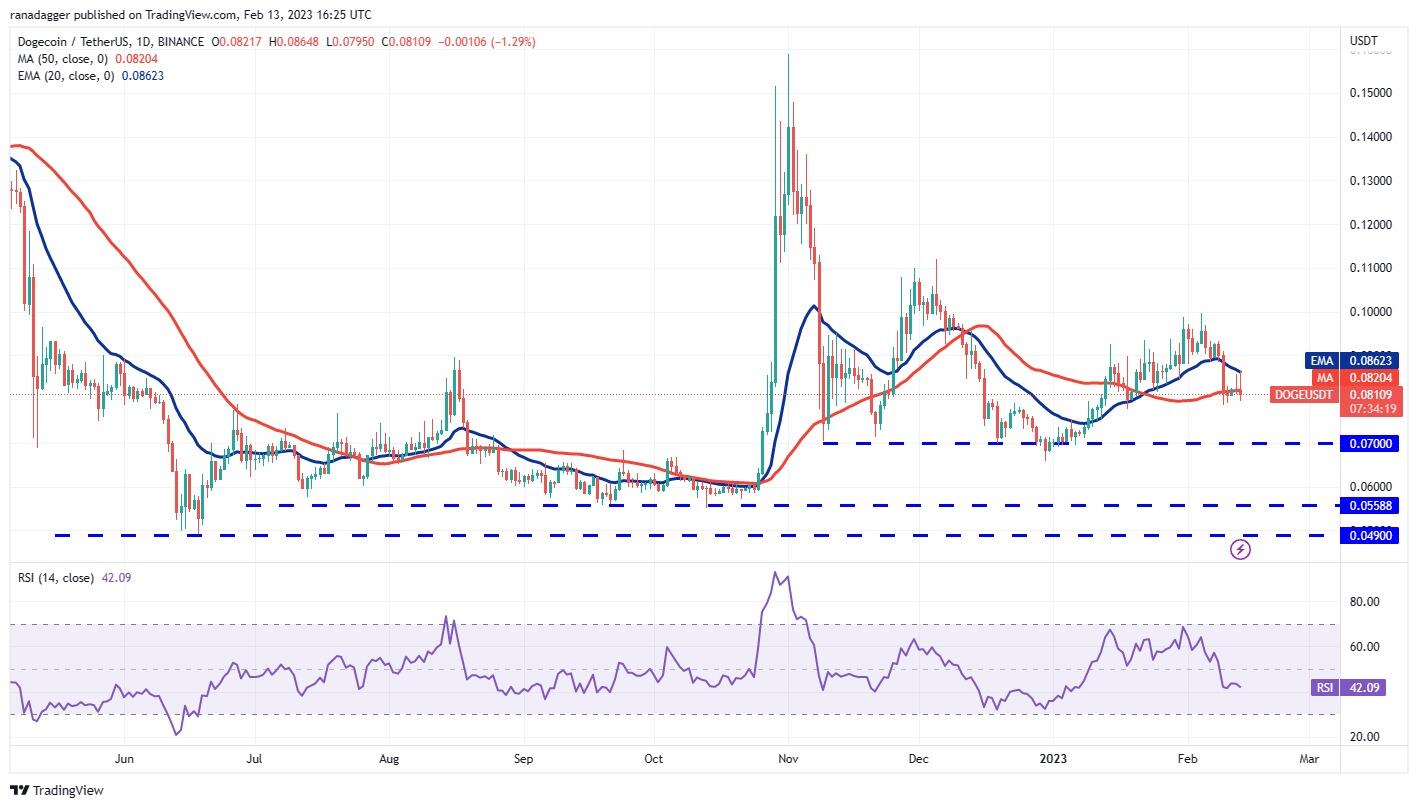
DOGE/USDT daily chart. Source: TradingView
If buyers propel the price above the 20-day EMA, the DOGE/USDT pair could rise to the psychological resistance at $0.10. The bears are expected to protect the zone between $0.10 and $0.11 with vigor because if it is scaled, the pair could pick up momentum and skyrocket to $0.15.
Conversely, if the price sustains below the 50-day SMA, the bears will attempt to sink the pair to the critical support at $0.07. This level is likely to attract aggressive buying by the bulls.
ADA/USDT
The bulls tried to push Cardano back above the 20-day EMA ($0.37) on Feb. 12 but the bears did not budge. This shows that the sellers are trying to gain the upper hand.

MATIC/USDT daily chart. Source: TradingView
The bears yanked the price below the immediate support at $0.35, which paves the way for a potential drop to the 50-day SMA ($0.34) and then to the crucial support at $0.32. A break below this level will suggest that bears are back in the driver’s seat.
If bulls want to prevent a deep correction, they will have to quickly kick the price above the $0.38 resistance. If the price sustains above this level, the ADA/USDT pair could climb to $0.41 and thereafter to $0.44. This level is likely to pose a strong challenge for the bulls.
MATIC/USDT
Buyers tried to propel Polygon above the $1.30 overhead resistance on Feb. 12 but the bears held their ground. This may have tempted short-term traders to book profits, which dragged the price below the 20-day EMA ($1.17).
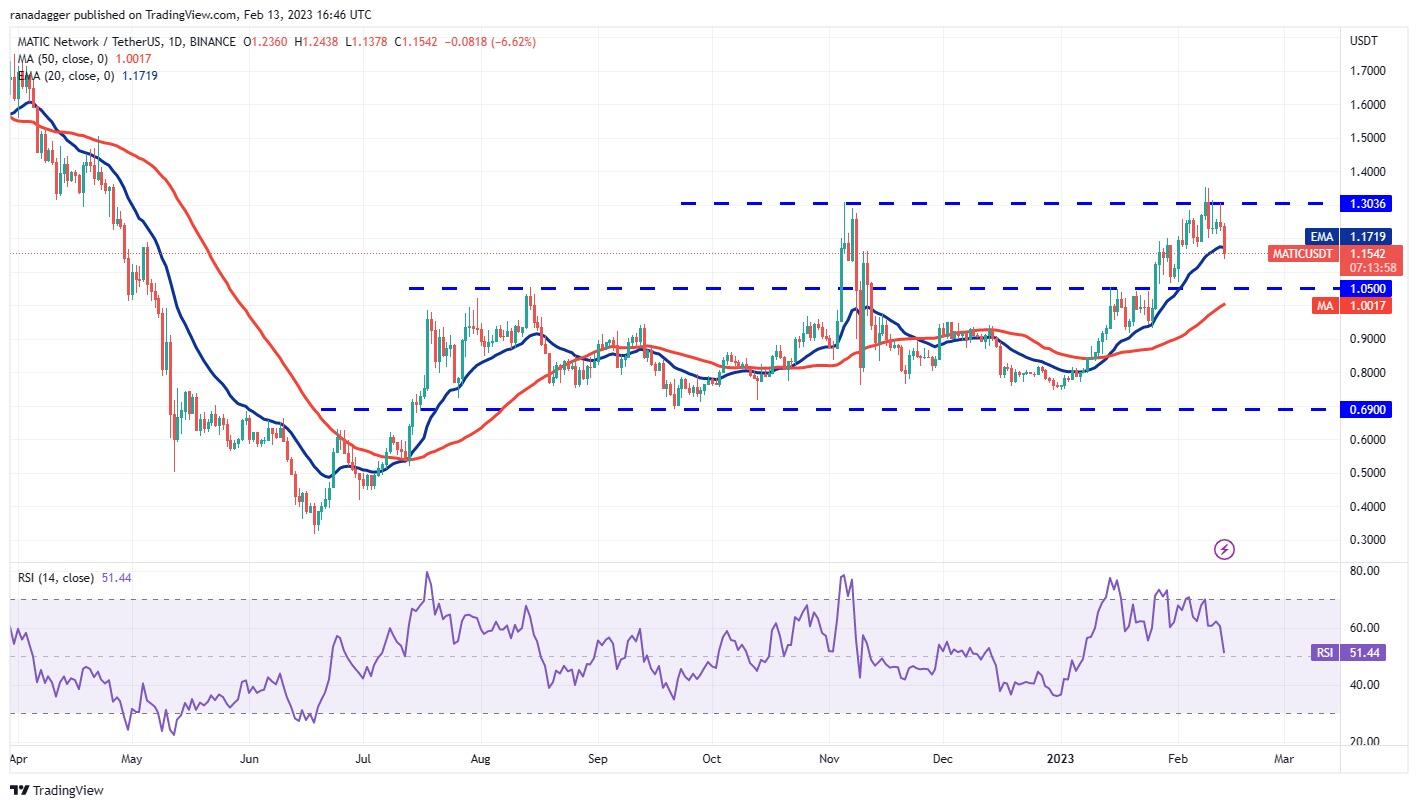
MATIC/USDT daily chart. Source: TradingView
If the bears sustain the price below the 20-day EMA, the MATIC/USDT pair could plummet to the 50-day SMA ($1.05). The zone between $1.05 and $1 is likely to attract buyers.
Usually, after such a deep correction, the next leg of the uptrend may not start at once. The price could oscillate between $1.30 and $1.05 for a few days before starting the next trending move.
Another possibility is that the price turns up from the current level and rises to the overhead resistance at $1.35.
SOL/USDT
Solana plunged below the 20-day EMA ($22.19) on Feb. 9 but the bears failed to pull the price below the 50-day SMA ($19.42) on Feb. 10. This shows that lower levels are attracting buyers.
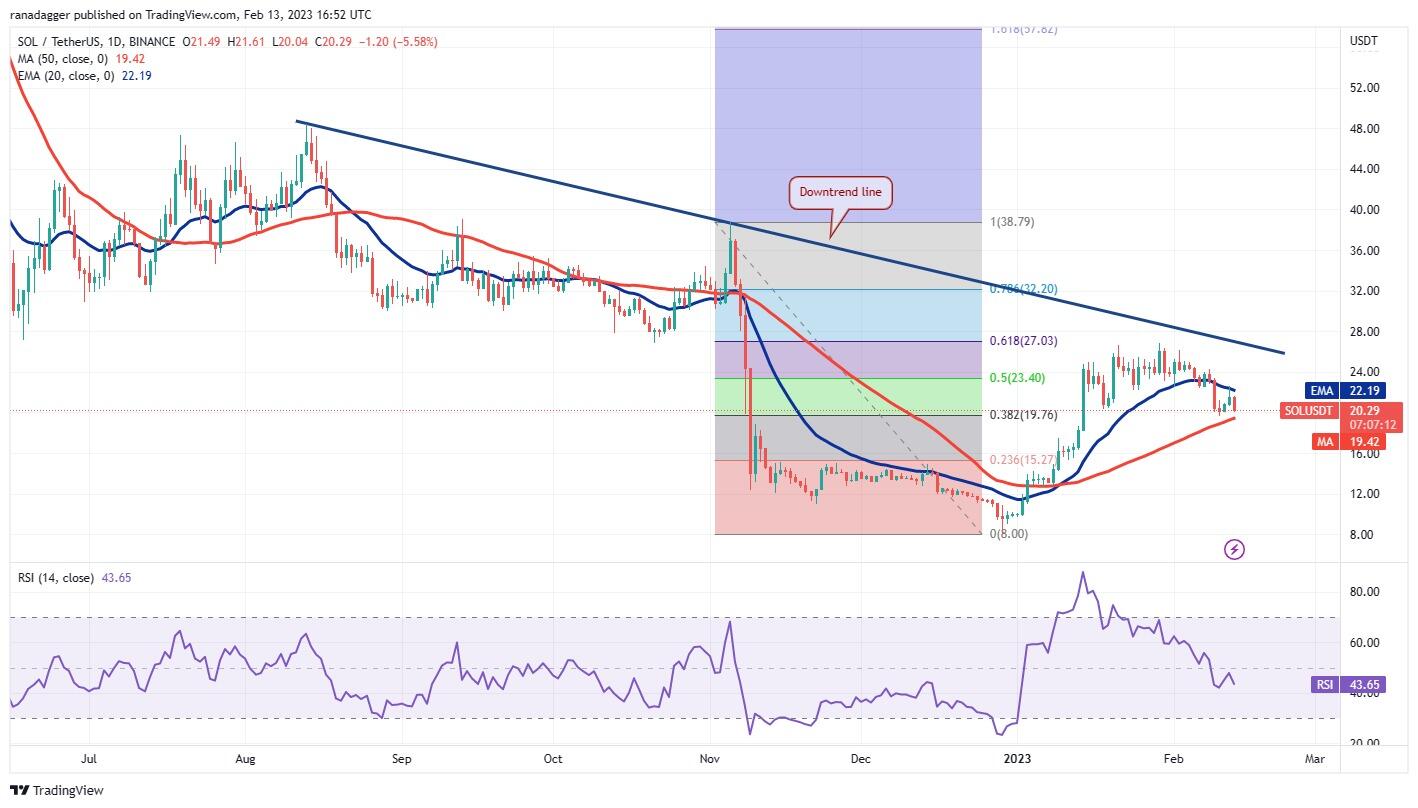
SOL/USDT daily chart. Source: TradingView
The price turned down from the 20-day EMA on Feb. 13, indicating that bears are trying to establish their supremacy. If the price slides below the 50-day SMA, the selling could pick up and the SOL/USDT pair may collapse to $15.
Contrarily, if bulls drive the price above the 20-day EMA, the pair could rise to the overhead resistance at $28. This is an important level to keep an eye on because a break above it will signal a potential trend change.
Author

Cointelegraph Team
Cointelegraph
We are privileged enough to work with the best and brightest in Bitcoin.


