Top 3 Price Prediction Bitcoin, Ethereum, Ripple: BTC flips the script as winds shift in bulls’ favor
- Bitcoin price is bouncing off the 200-day EMA and is heading into the $22,628 to $23,350 supply zone.
- Ethereum price shows a resurgence of buyers, ETH bulls eye a retest of the monthly resistance level at $1,677.
- Ripple price spins the same old story as it struggles to overcome the $0.380 to $0.400 hurdle.

Bitcoin (BTC) price indicates a clear shift in momentum after the February 14 inflation numbers announcement. Most participants’ expectations of an unusual spike in headline inflation were put out, which led to a flip in the outlook from cautiously bearish to bullish. Hence, the markets are likely to continue the 2023 bull run, which will propel Ethereum, Ripple and altcoins with it.
Also read: US CPI Analysis: Sticky inflation? What is sticky is the downtrend, stocks to rally, USD to fall
Bitcoin price to continue its rally
Bitcoin price saw a 1.96% daily candlestick on February 14, which was followed by a green ‘one’ buy signal from the Momentum Reversal Indicator (MRI). Combined with the bullish sentiment post-inflation announcement, BTC looks ready to tag the supply zone, extending from $22,628 to $23,350 supply zone at a minimum.
If bulls put their backs into this rally and produce a decisive flip of the $25,000 psychological level, the chances of a $30,00 BTC will increase vastly. In such a case, the crypto market will enter a period of bull run phase, where the big crypto’s ascent will cause other altcoins to rally with it.
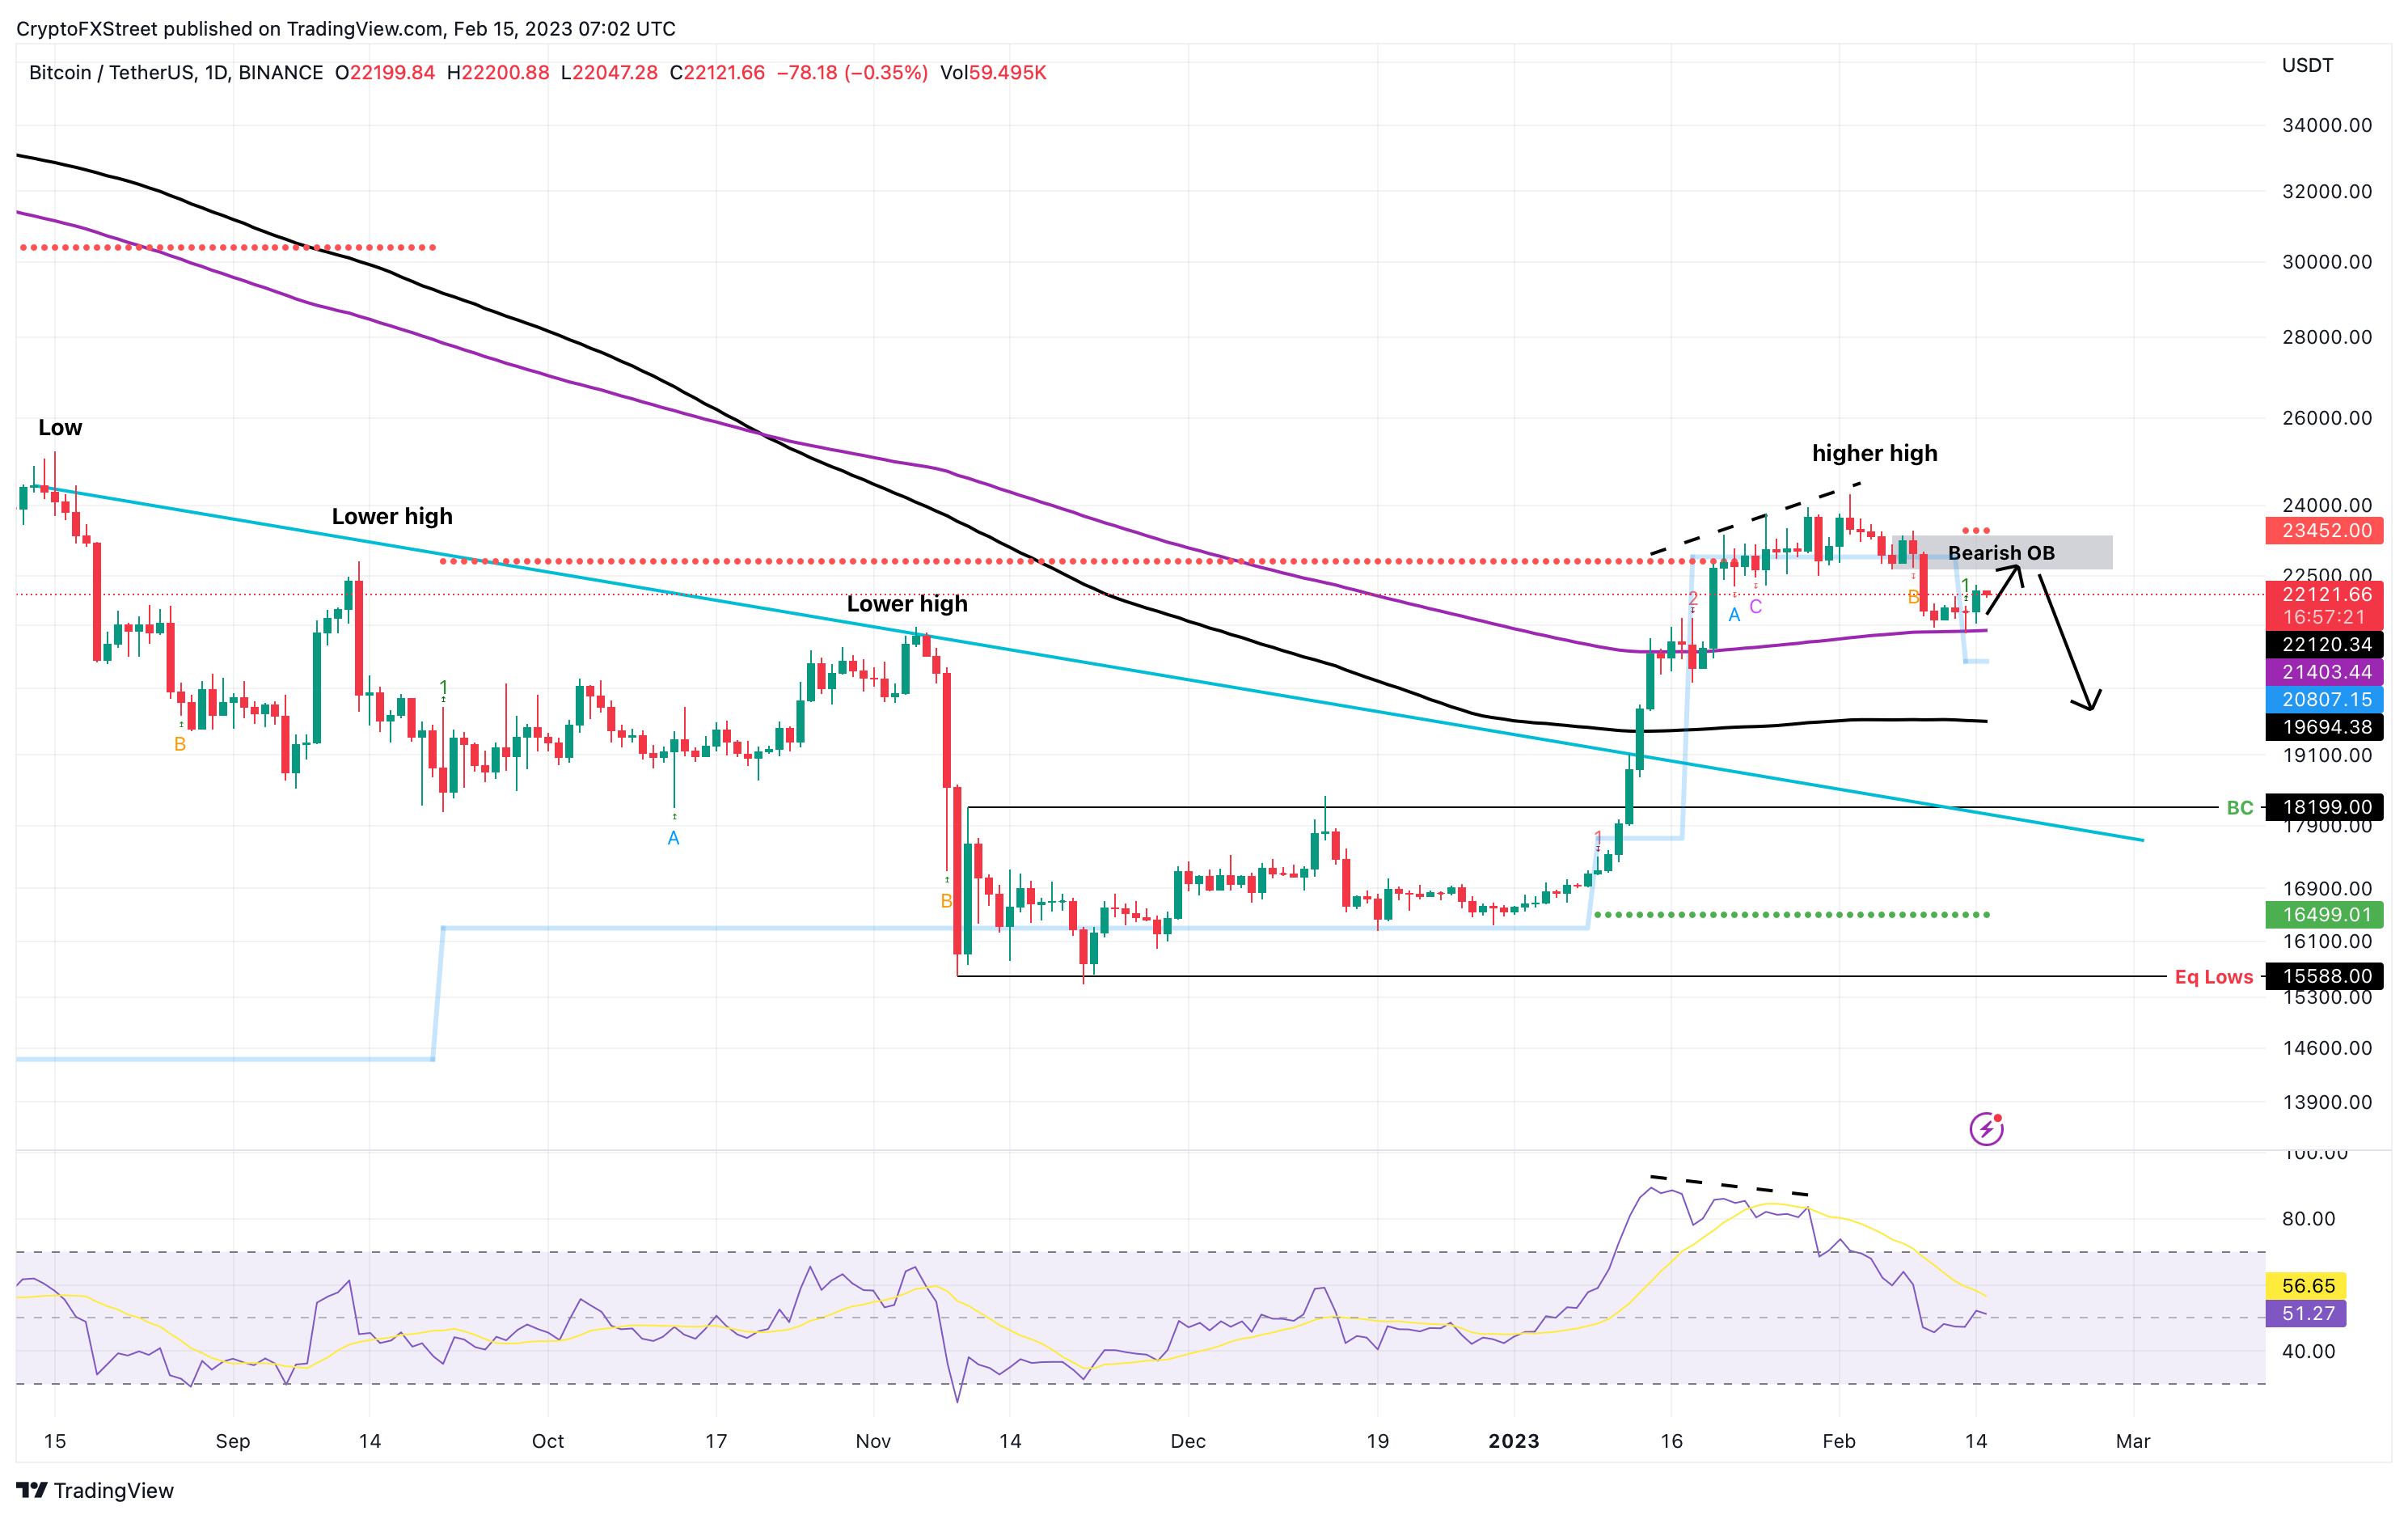
BTC/USD 1-day chart
On the other hand, if the Bitcoin price gets rejected at the supply zone, investors need to sit back and wait for a bearish confirmation. A daily candlestick close below the 200-day Exponential Moving Average (EMA) will be the required signal for short-sellers to jump in.
This development that flips the 200-day EMA would produce a lower low and potentially trigger a minor correction to the 200-day Simple Moving Average (SMA) at $19,694. Such a move would also strengthen the possibility of a steeper correction that aligns with the macro bearish outlook and potentially crash BTC to November 2022 lows at $15,588.
Ethereum price shows bullish signs
Ethereum price has produced a bullish divergence with the Relative Strength Index (RSI) and Awesome Oscillator (AO) on the four-hour chart.
This setup occurs when the momentum indicators are producing higher lows, denoting the rising demand in the market, but Ethereum price fails to reflect the same and continues to slide lower, producing lower lows. The underlying non-conformity often results in a rally of the asset’s price.
The same was seen with ETH, which shot up 6.28% in the last 24 hours. Going forward, Ethereum price could attempt to overcome the immediate hurdle at $1,579 and make a run for the monthly resistance level at $1,677 and even tag the $1,700 whole number.
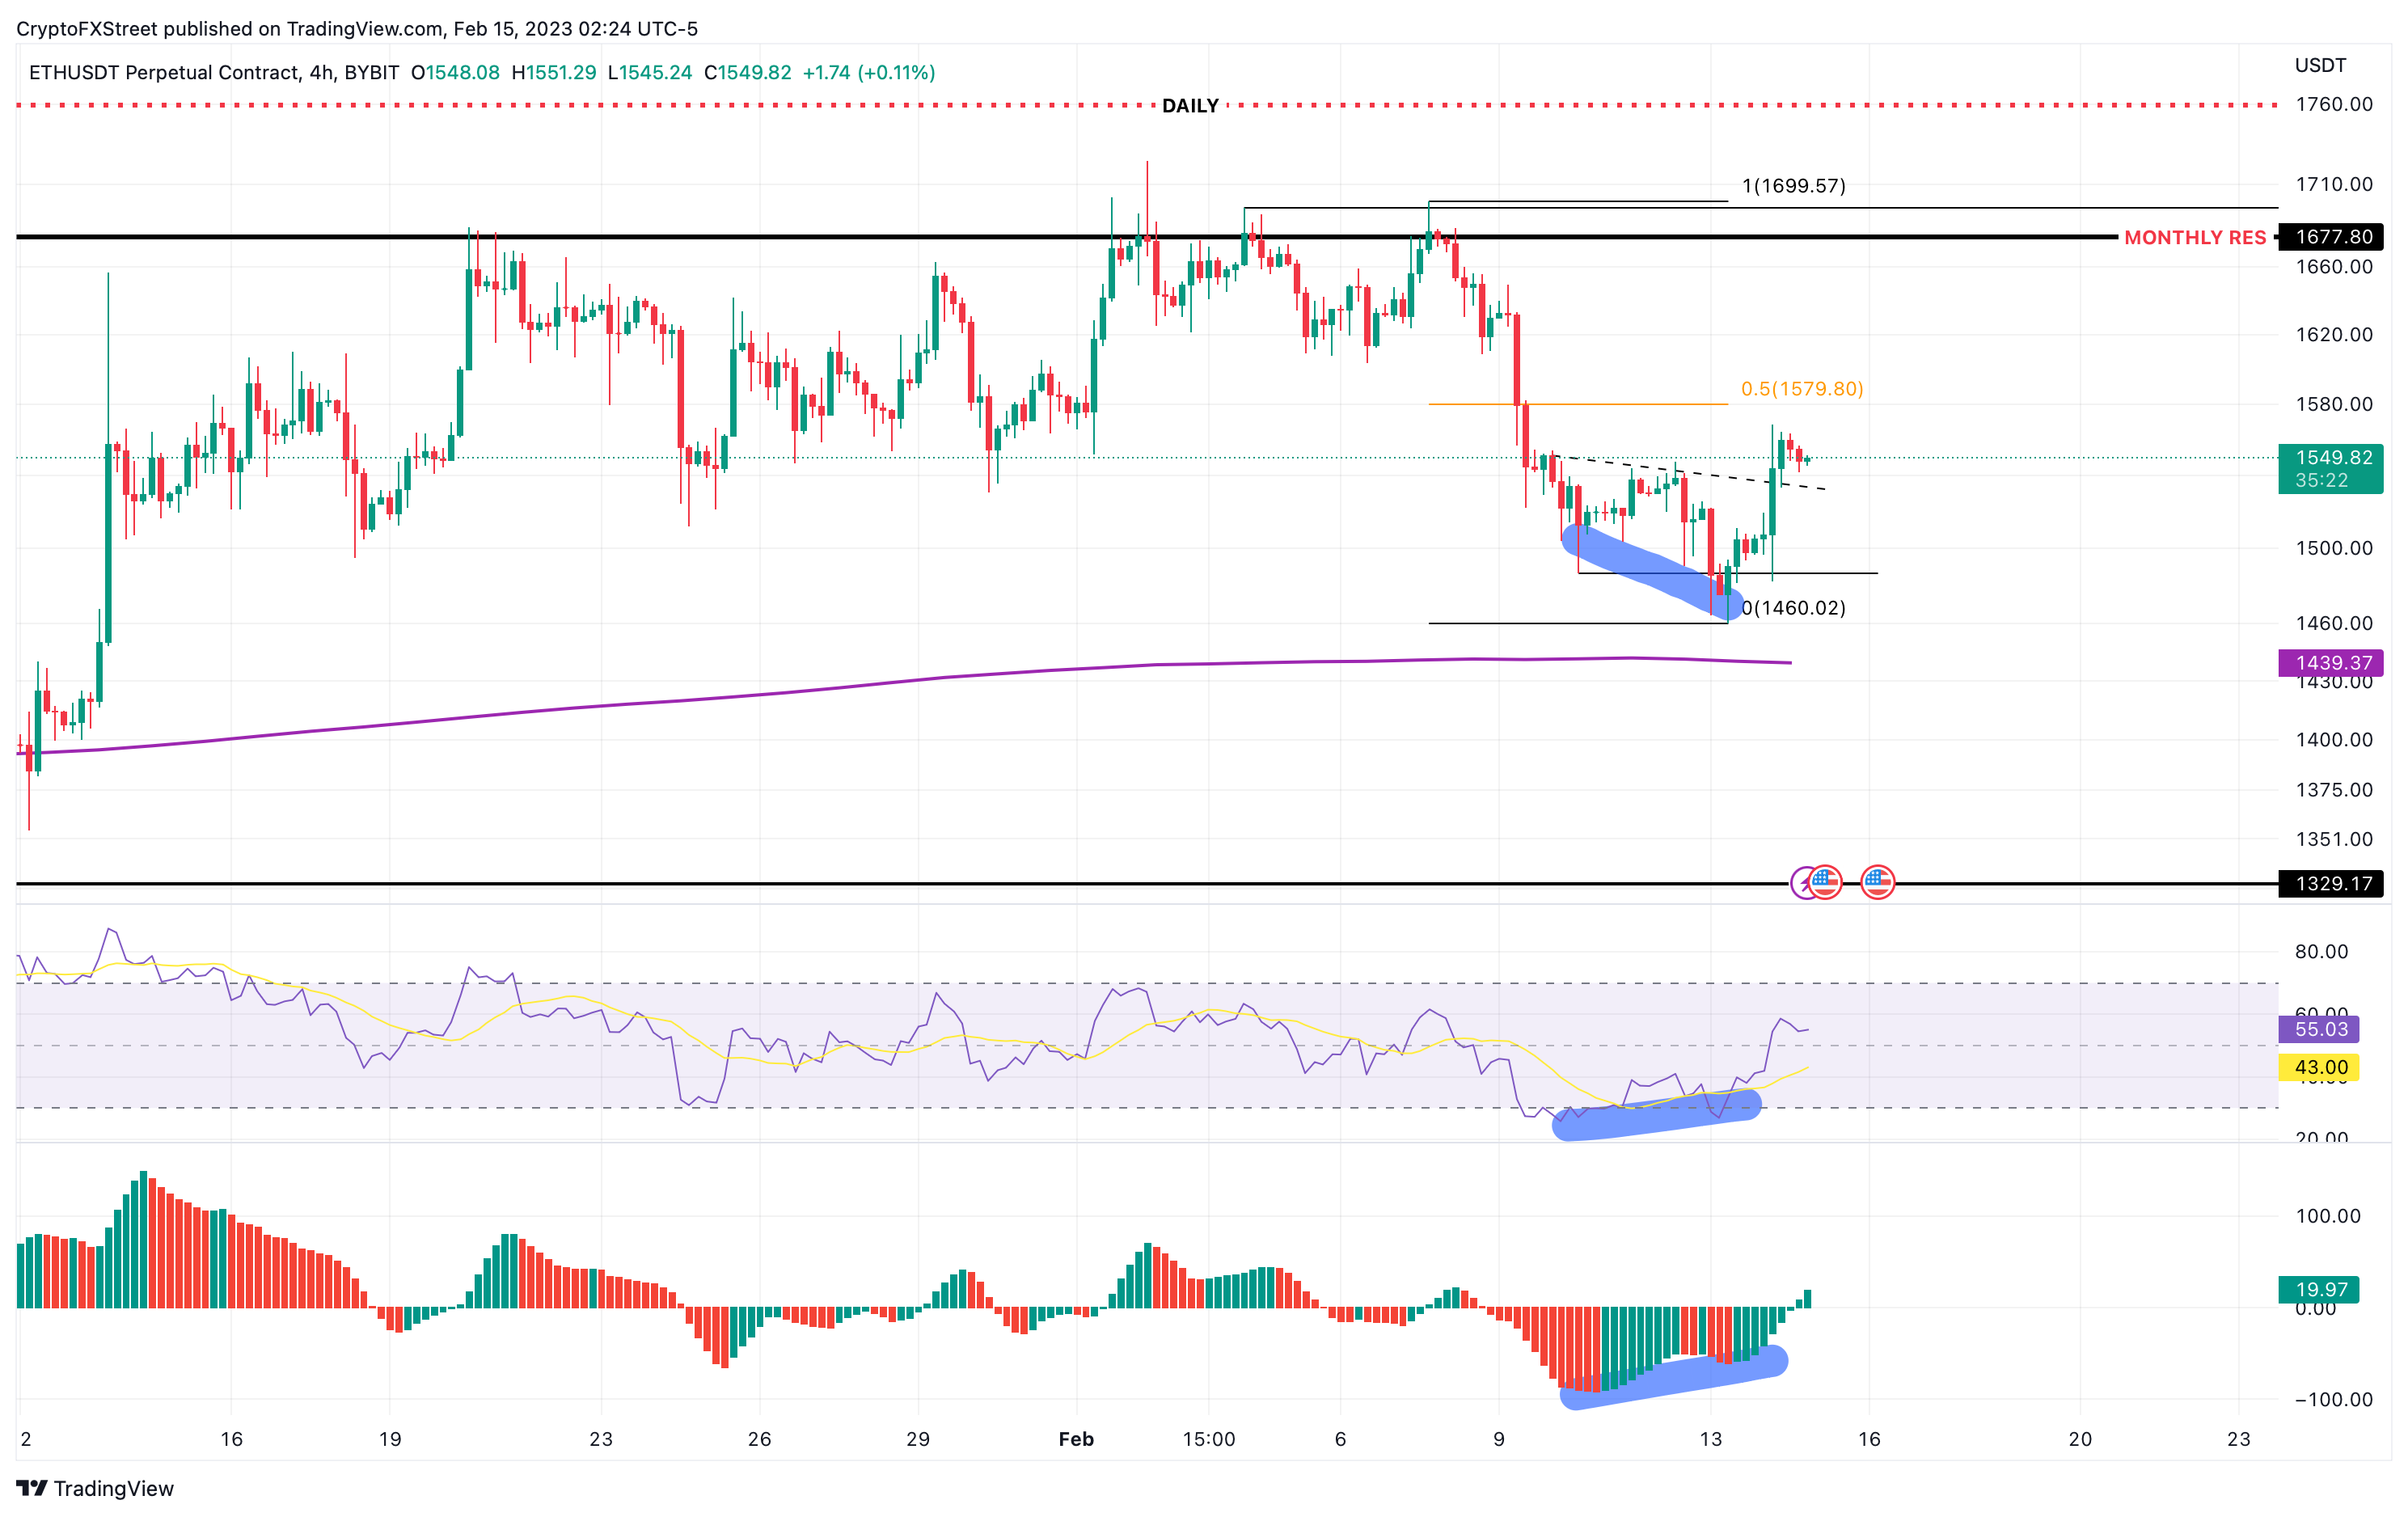
ETH/USD 4-hour chart
While the bullish divergence setup was reliable, Ethereum price needs to continue this ascent. A breakdown of the $1,460 swing low would invalidate the optimism and trigger a bearish outlook. In such a case, ETH could tag the 200-day SMA at $1,439 and even dive as low as $1,329.
Ripple price tries hard
Ripple price has slipped below the $0.380 to $0.400 resistance zone for the fourth time in the last nine months. This area has been extremely critical and troubling for XRP bulls to overcome. Until this hurdle is flipped into a support structure, the remittance token is likely to continue chopping.
A successful flip of $0.400, which also coincides with the 200-day SMA, will be a key buy signal. If such a move were to occur, Ripple price would likely propel to $0.506 and sweep this level to collect the buy-stop liquidity resting above it.
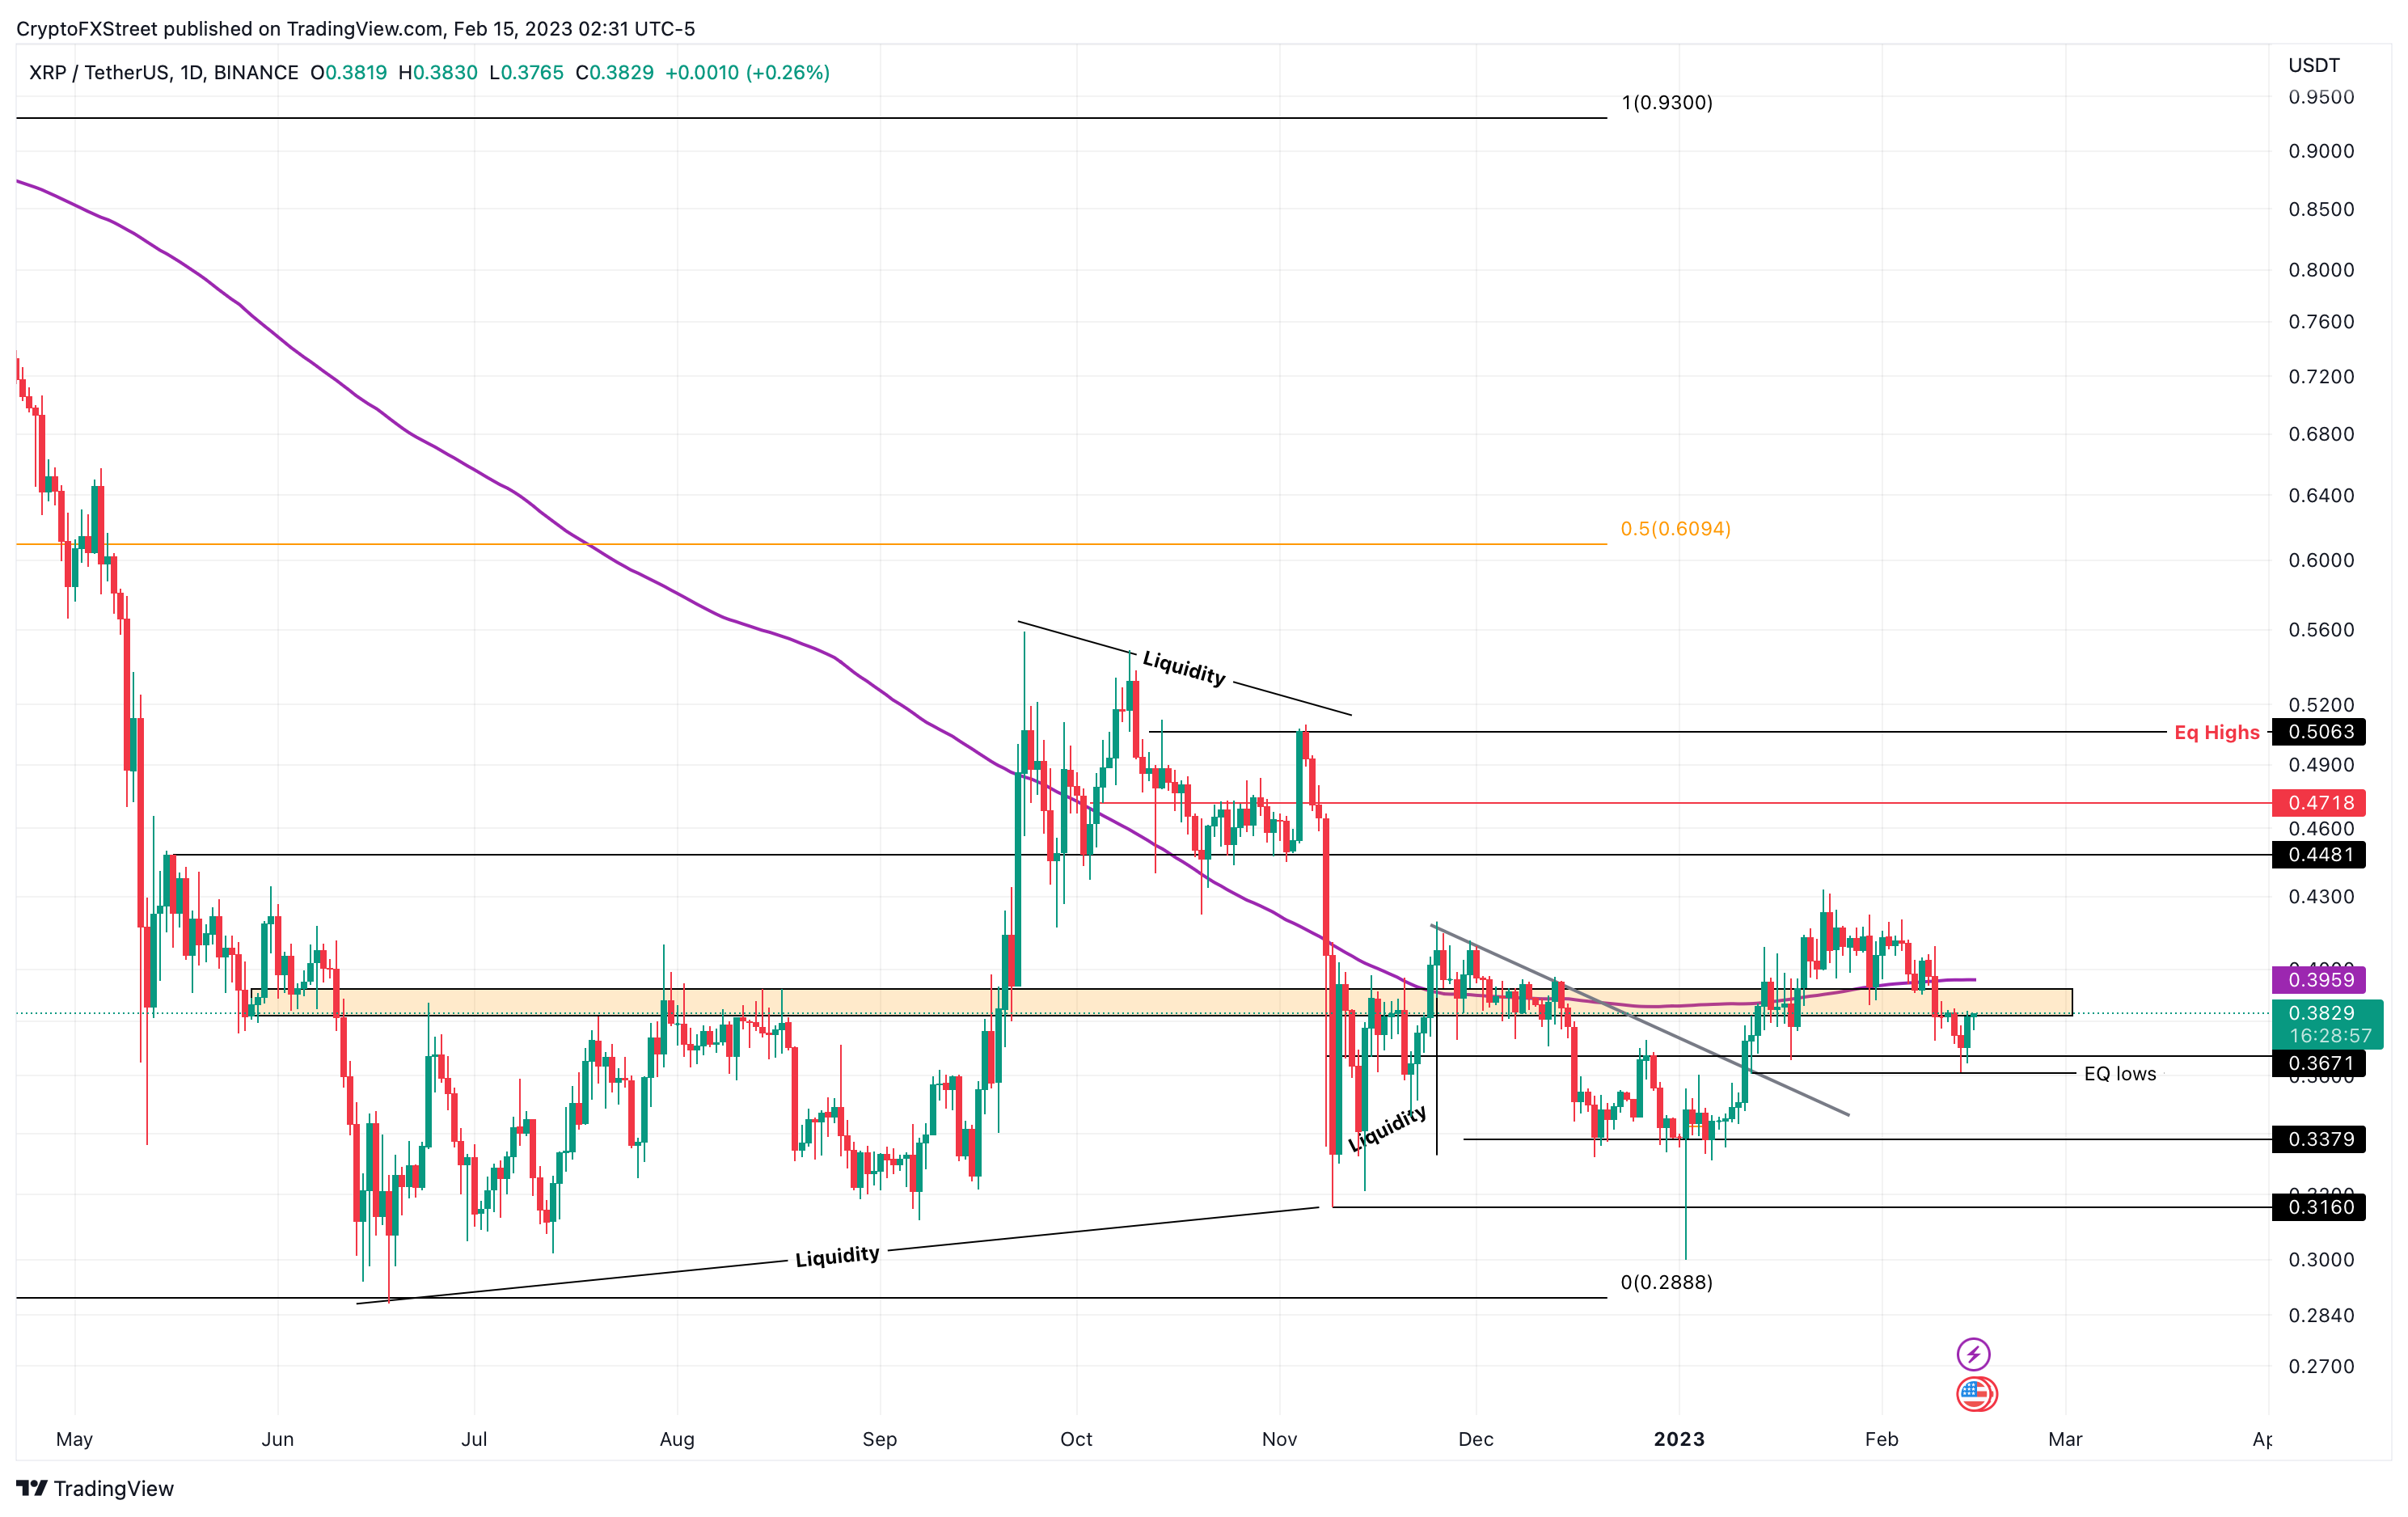
XRP/USD 1-day chart
Regardless of the bullish projections, if Ripple price fails to overcome the $0.380 to $0.400 hurdle, it will be of no use. A rejection at this area followed by a daily candlestick close below $0.361 will create a lower low and invalidate the bullish thesis. This move could potentially trigger a 12% correction to $0.316.
Author

Akash Girimath
FXStreet
Akash Girimath is a Mechanical Engineer interested in the chaos of the financial markets. Trying to make sense of this convoluted yet fascinating space, he switched his engineering job to become a crypto reporter and analyst.


