Top 3 Price Prediction Bitcoin, Ethereum, Ripple: Brutal correction was bound to happen, expect more to come
- Bitcoin price slides below key support level and could tank further into next week.
- Ethereum price sees falling knife stopping in no man’s land, gradual grind lower looks like most logical sequence.
- XRP price gets support and bounces a bit, but severe warnings accompany price action.

Bitcoin price, Ethereum and other cryptocurrencies had their comeuppance last night as the US trading session turned blood-red. Plenty of bulls were lured into the short uptrend on Tuesday and Wednesday, but then BTC lost more than 6% in the ensuing sell-off. Expect to see more demand go out of the window as plenty of traders will be falling off their chairs when looking at the big red negative P/L staring them in the face Friday morning.
Bitcoin price action needs to give traders helmets as price action set to collapse below $20,000
Bitcoin (BTC) price had a harsh correction on Thursday near the US closing bell as US equities tanked. It became clear to more and more traders that the Federal Reserve is not halting rate hikes anytime soon, and any trading plan relying on a Goldilocks scenario needs to be shelved. Expect to see more outflow of risk assets with cryptocurrencies as the first victim.
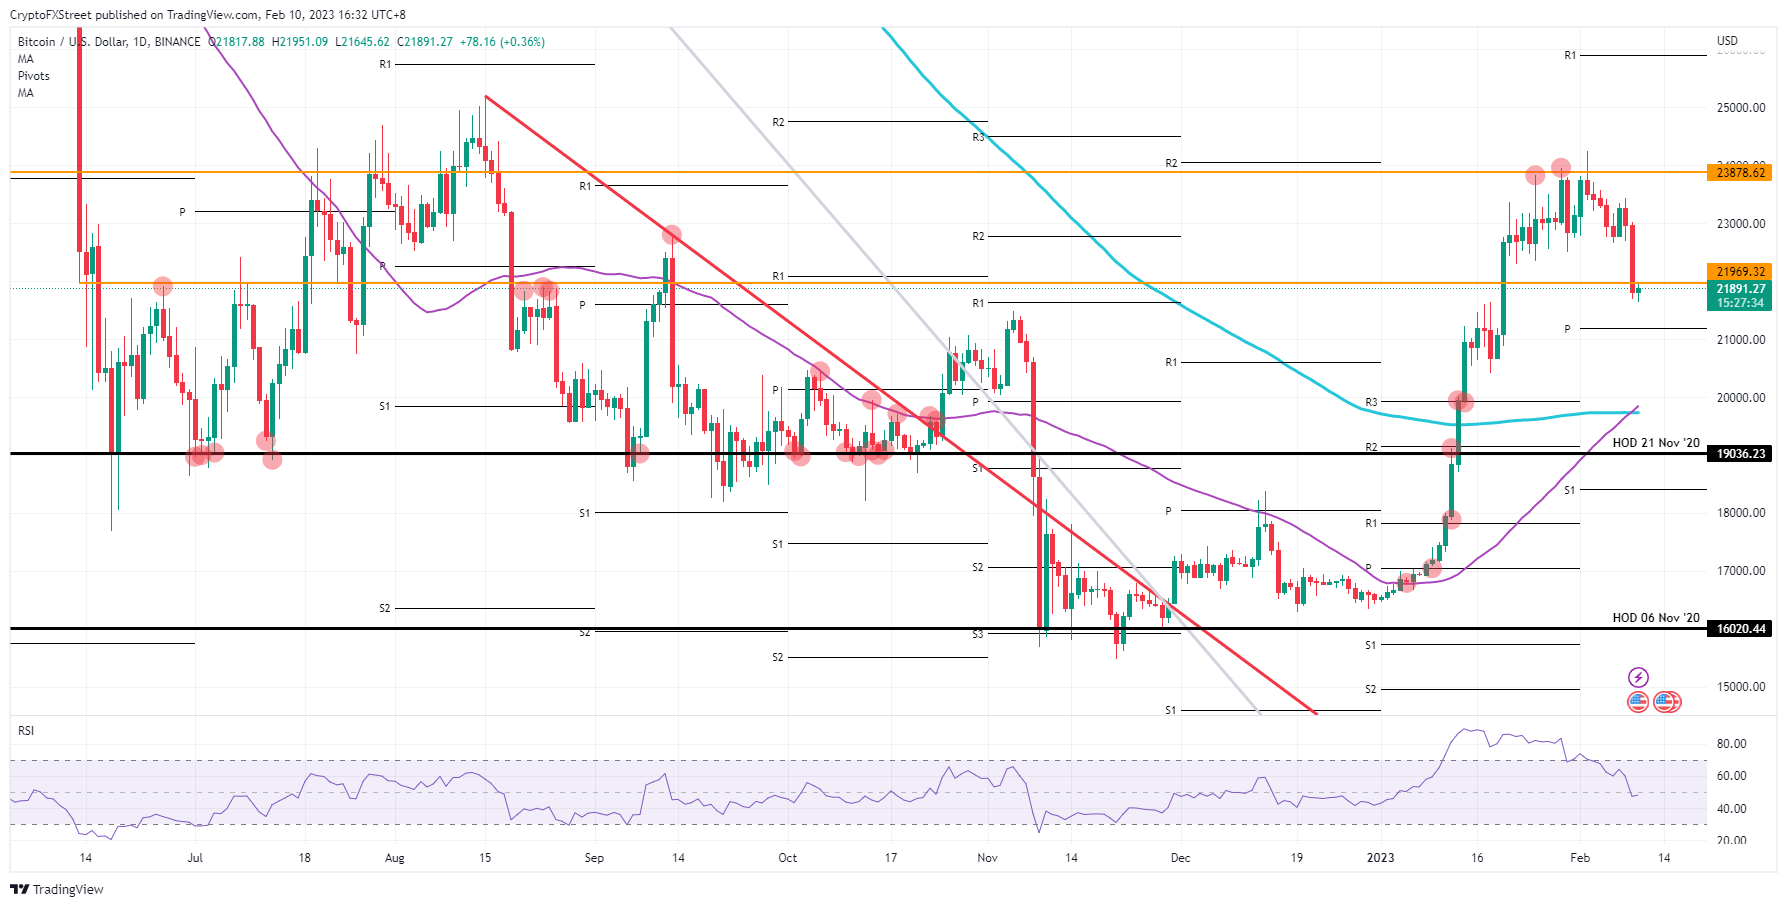
BTC traders awakening Friday morning are seeing another element pushing price action to the downside: fear for war escalation in Ukraine as Russia began its offensive Friday morning. Several reports are coming in from drone attacks and mortars along the frontline in the Donbas region. Expect selling pressure throughout the day with a likely drop in Bitcoin price toward $19,742, where both the 55-day and the 200-day Simple Moving Averages (SMAs) are at a crossroads.
BTC/USD daily chart
A bounce could happen as traders want to pick up some Bitcoins at a nice discount. Certainly, the $21,969 will attract plenty of traders to be active around this area if BTC price pushes back above that level. A daily close this evening could see some recovery follow-through over the weekend toward $23,878.
Ethereum price still has room for downside as vital support is nowhere nearby
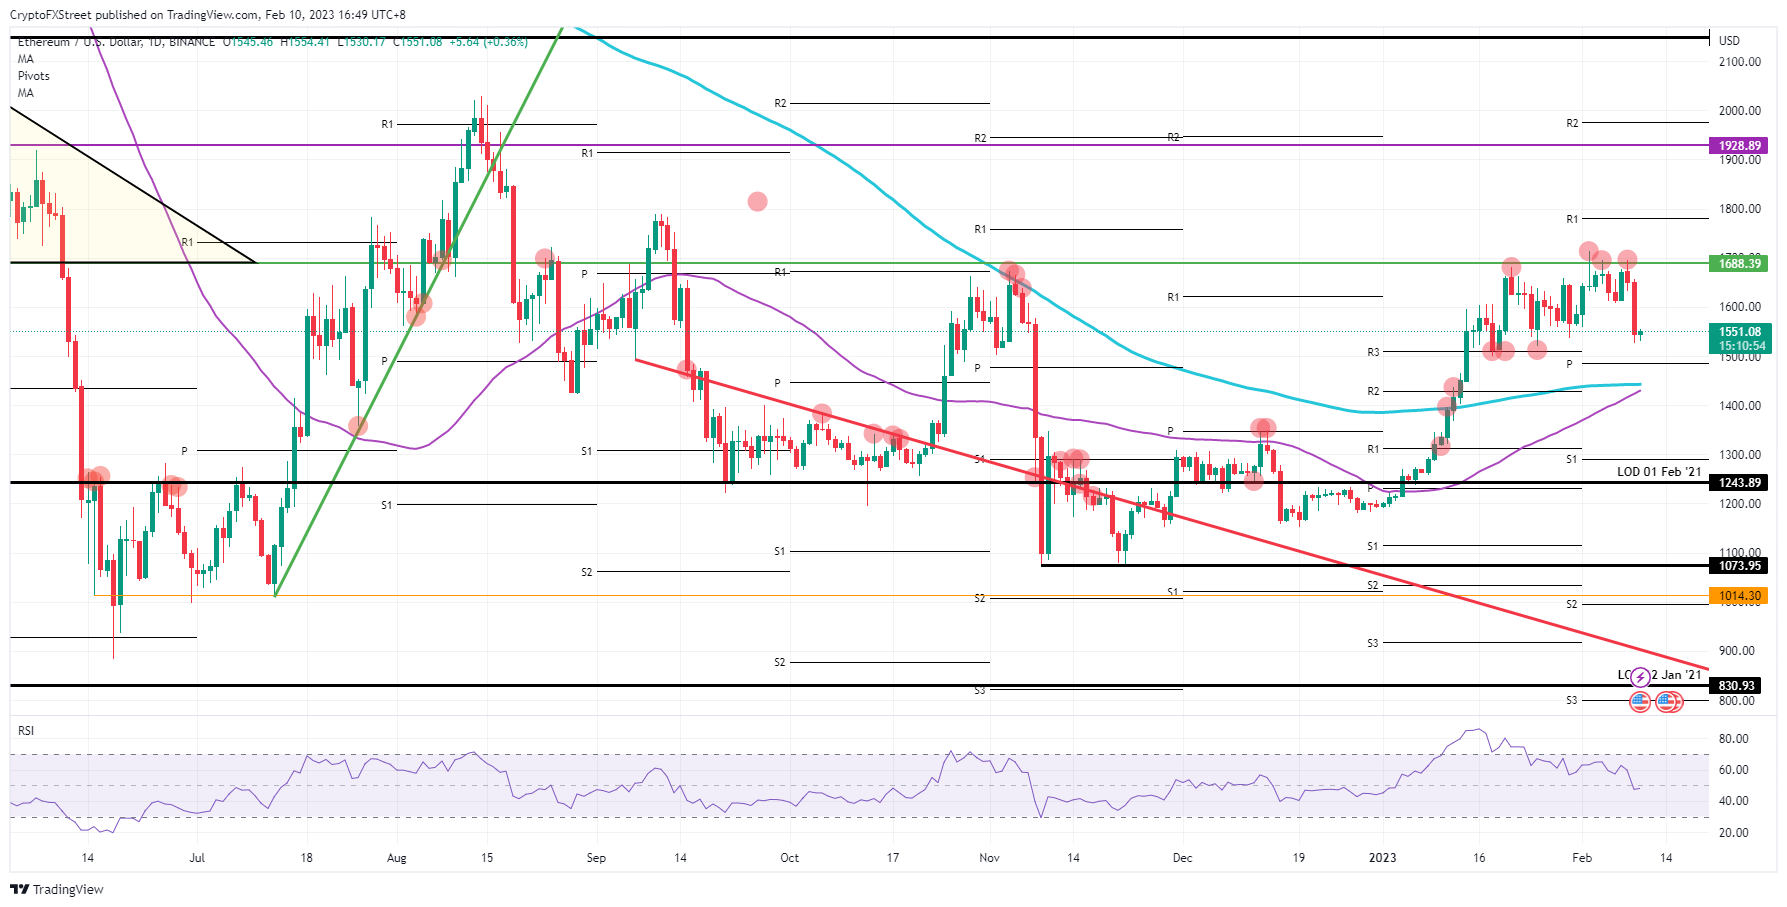
Ethereum (ETH) price has defined its weak spot this week as the $1,688 level is triggering another firm rejection for bulls. The bears are defending any uptick above it and match the buy action with plenty of selling volume to push price action into the ground. This frustrates ETH traders who want to go long, and with the washout from Thursday they could be out for quite awhile.
Meanwhile, ETH is getting headwinds from the geopolitical side as a new offensive has begun just hours after Zelenskyy visited Brussels and London with a demand for fighter jets. Expect Ethereum price to decline further as there are currently too many tail risks that could erupt. A better price tag to match the market narrative is around $1,441.
ETH/USD daily chart
Any upside could come late this Friday evening on the back of the US Michigan Survey, with inflation expectations and Consumer Sentiment due to come out. Should the numbers project a further decline in inflation and a jump in consumer sentiment, bullish sentiment would reignite on the back of that. Ethereum price would swing back to $1,688 and test that high again over the weekend.
XRP price looks to be the best tradable crypto of the top 3
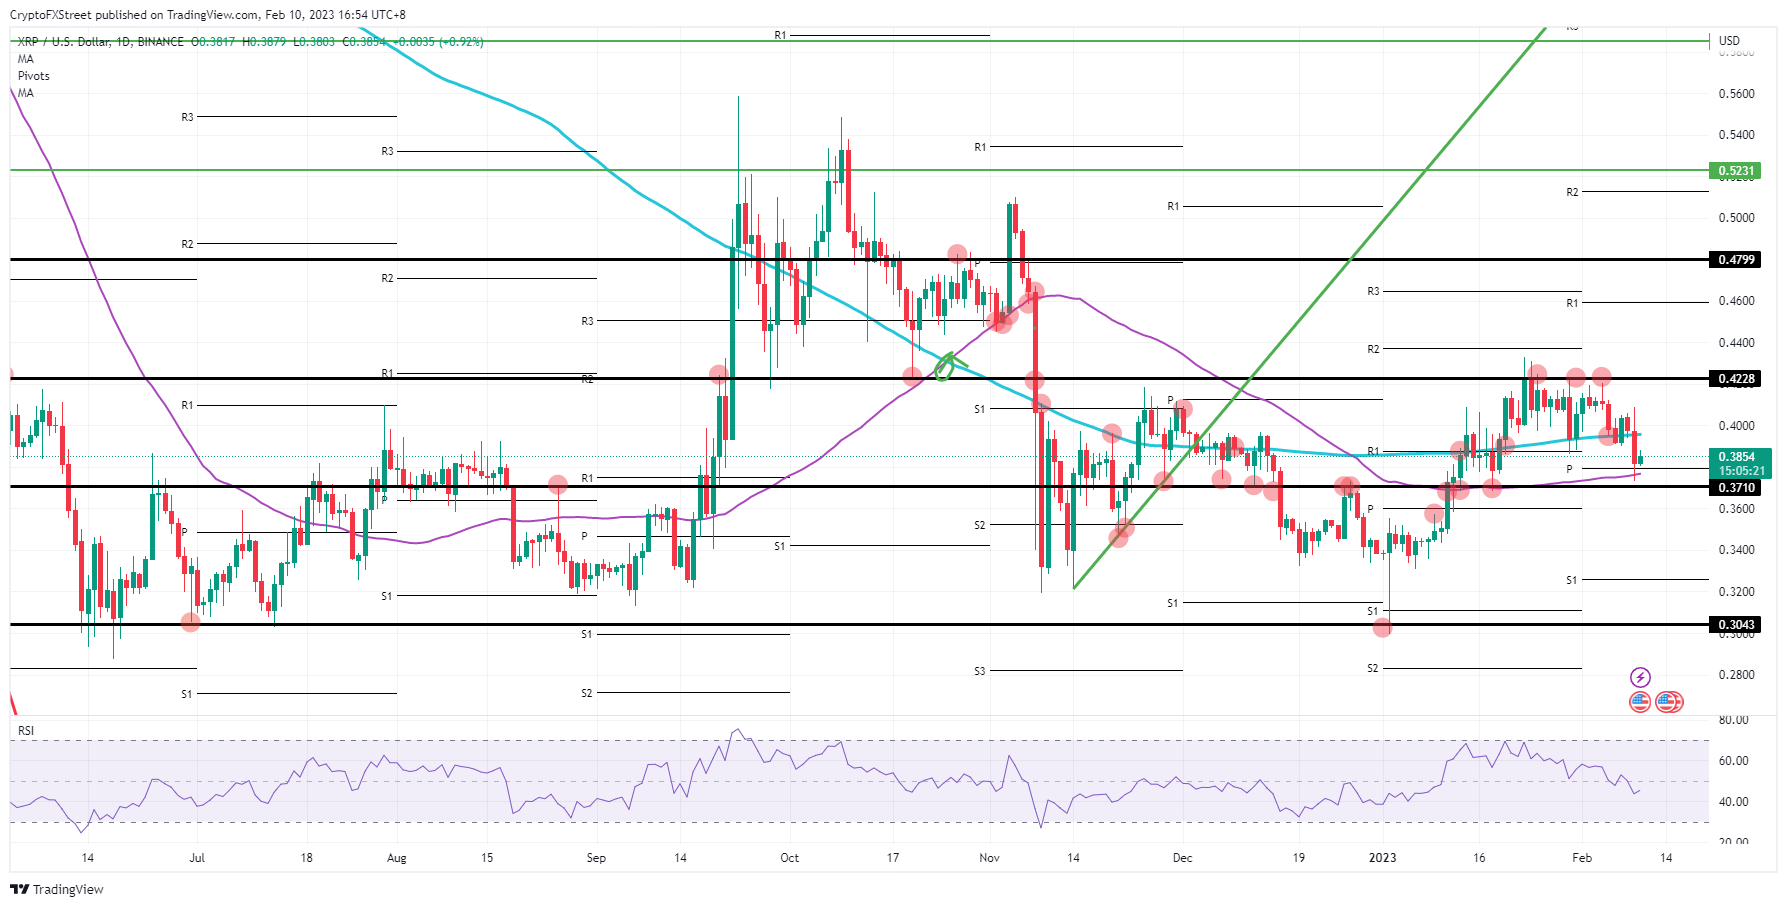
Ripple (XRP) price holds the best cards regarding trade management. With a firm drop toward $0.3710, price action bounced back above the 55-day Simple Moving Average (SMA) and the monthly pivot. Traders who want to be bullish can easily enter and place their stops just below either of the above levels.
XRP needs to be labeled with a warning as the geopolitical tension flares up. The EU summit in Brussels on Friday could elevate risk if the go-ahead for delivering fighter jets to Ukraine is given. Expect more downward pressure toward $0.3710. Once broken, unfortunately, the whole rally of January becomes exposed as $0.3043, the first major support area to look for.
XRP/USD daily chart
As mentioned in the above paragraph, a rally could be granted purely on the back of technical forces. With two key support levels already being salvaged after the nosedive move from Thursday, more recovery could be granted. Expect a push higher toward $0.4228 that fully erases the incurred losses from Thursday if that is the case.
Author

Filip Lagaart
FXStreet
Filip Lagaart is a former sales/trader with over 15 years of financial markets expertise under its belt.



