Top 3 meme coins Dogecoin, Shiba Inu and Pepe: Rally continues
- Dogecoin, Shiba Inu and Pepe extend gains on Friday after Thursday’s surge.
- The three meme coins have broken above bullish technical formations, signaling the possibility of further gains ahead.
- The RSI reaches overbought levels for DOGE, SHIB and PEPE, increasing the odds of a corrective pullback.
The prices of the top 3 meme coins by market capitalization, Dogecoin (DOGE), Shiba Inu (SHIB) and Pepe (PEPE), extend their gains on Friday after a rally on Thursday. The technical outlook for the three coins hints at further gains ahead as they all broke above bullish technical patterns.
Dogecoin breaks from wedge
Dogecoin price broke above the falling wedge pattern (drawn by connecting multiple high and low levels with a trendline from early March) on Thursday. As of Friday, it continues to trade higher, around $0.123, the highest level since the beginning of August.
If the breakout level of around $0.115 holds as support, DOGE could rally 15% to retest its daily resistance level at $0.141.
The Moving Average Convergence Divergence (MACD) indicator supports Dogecoin’s rise after posting a bullish crossover on the daily chart on September 9. Additionally, green histogram bars are rising and above the neutral line zero, suggesting the continuation of upward momentum.
However, the Relative Strength Index (RSI) is nearing the overbought level of 70. If it enters the zone on a closing basis, traders will be advised not to add to their long positions as the chances of a price pullback increase. Another option is that the rally continues, and the RSI climbs further up into overbought and remains there.
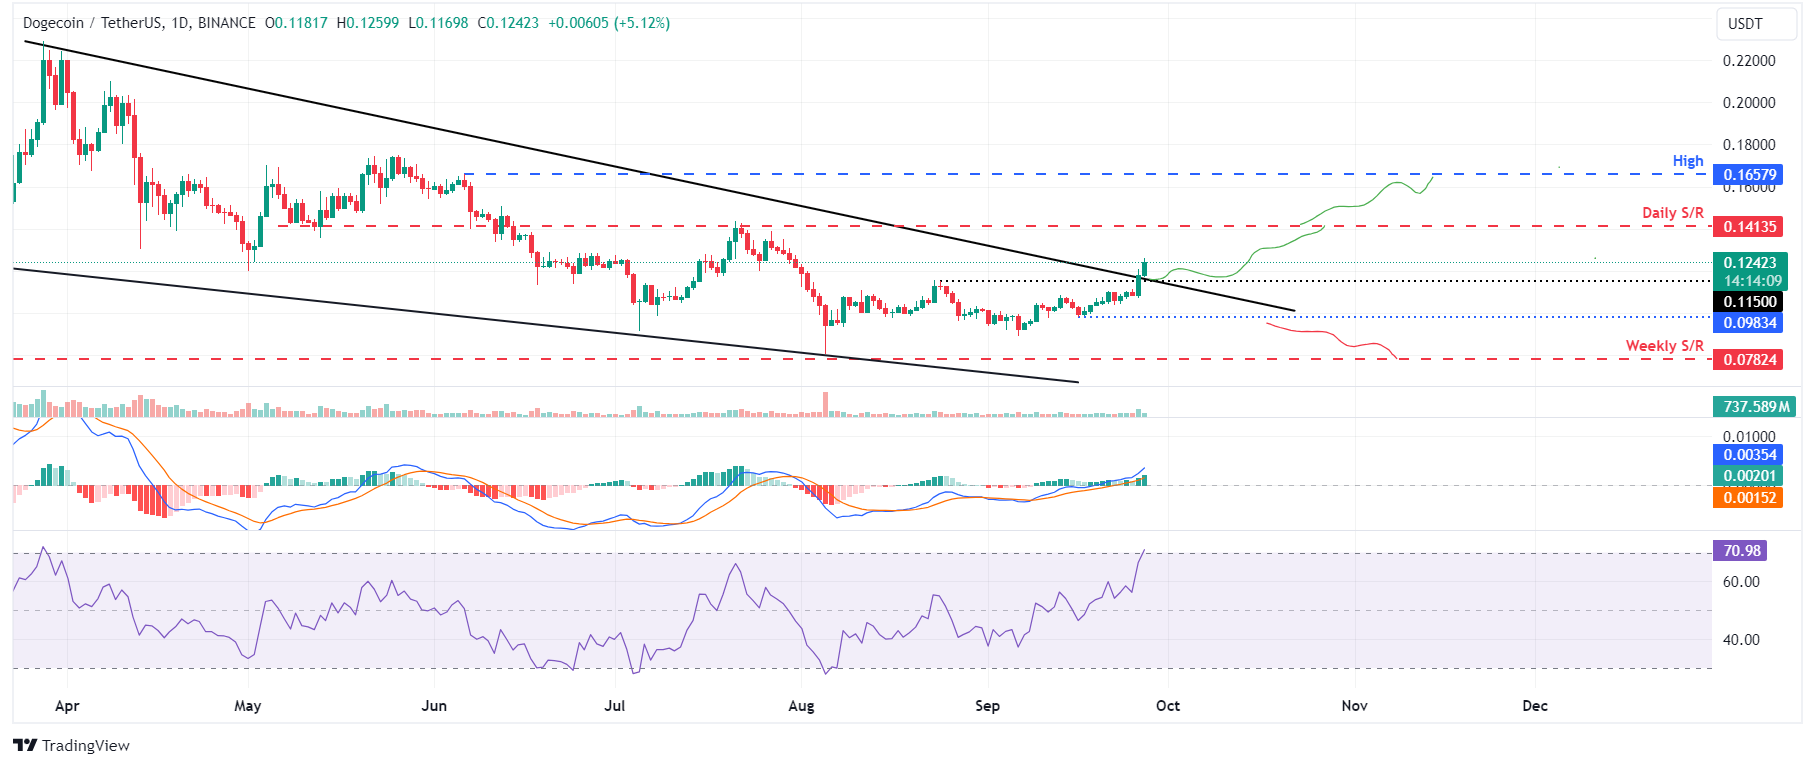
DOGE/USDT daily chart
On the other hand, If Dogecoin fails to find support around the breakout level of around $0.115 and continues to decline to close below the September 16 low of $0.098, the bullish thesis would be invalidated. This development would extend the decline to retest its weekly support level at $0.078.
Shiba Inu price hold gains from Thursday’s 22% surge
Shiba Inu’s price broke above the symmetrical triangle on September 20 and rallied 29% in the next six days. On Thursday, it also closed above its weekly resistance level at $0.000016. As of Friday, it continues to trade higher around $0.000019.
If the weekly resistance level at $0.00016 holds as support, SHIB could continue its rally from its current trading level to retest its September 16 high of $0.000020.
If the bulls are aggressive and SHIB closes above $0.000020. It would extend the rally by 15% to retest its technical target of the symmetrical triangle pattern (obtained by measuring the distance between the first daily high and the first daily low to the breakout point) at $0.000023.
The MACD indicator on the daily chart supports SHIB’s rise after the bullish crossover seen on September 10, when the. The MACD line (blue line) moved above the signal line (yellow line). Green histogram bars are also rising above the neutral line zero.
However, the Relative Strength Index (RSI) stands at 80, trading above its overbought level of 70. Traders should be cautious and will be advised not to add to their long positions because the chances of a price pullback are increasing.
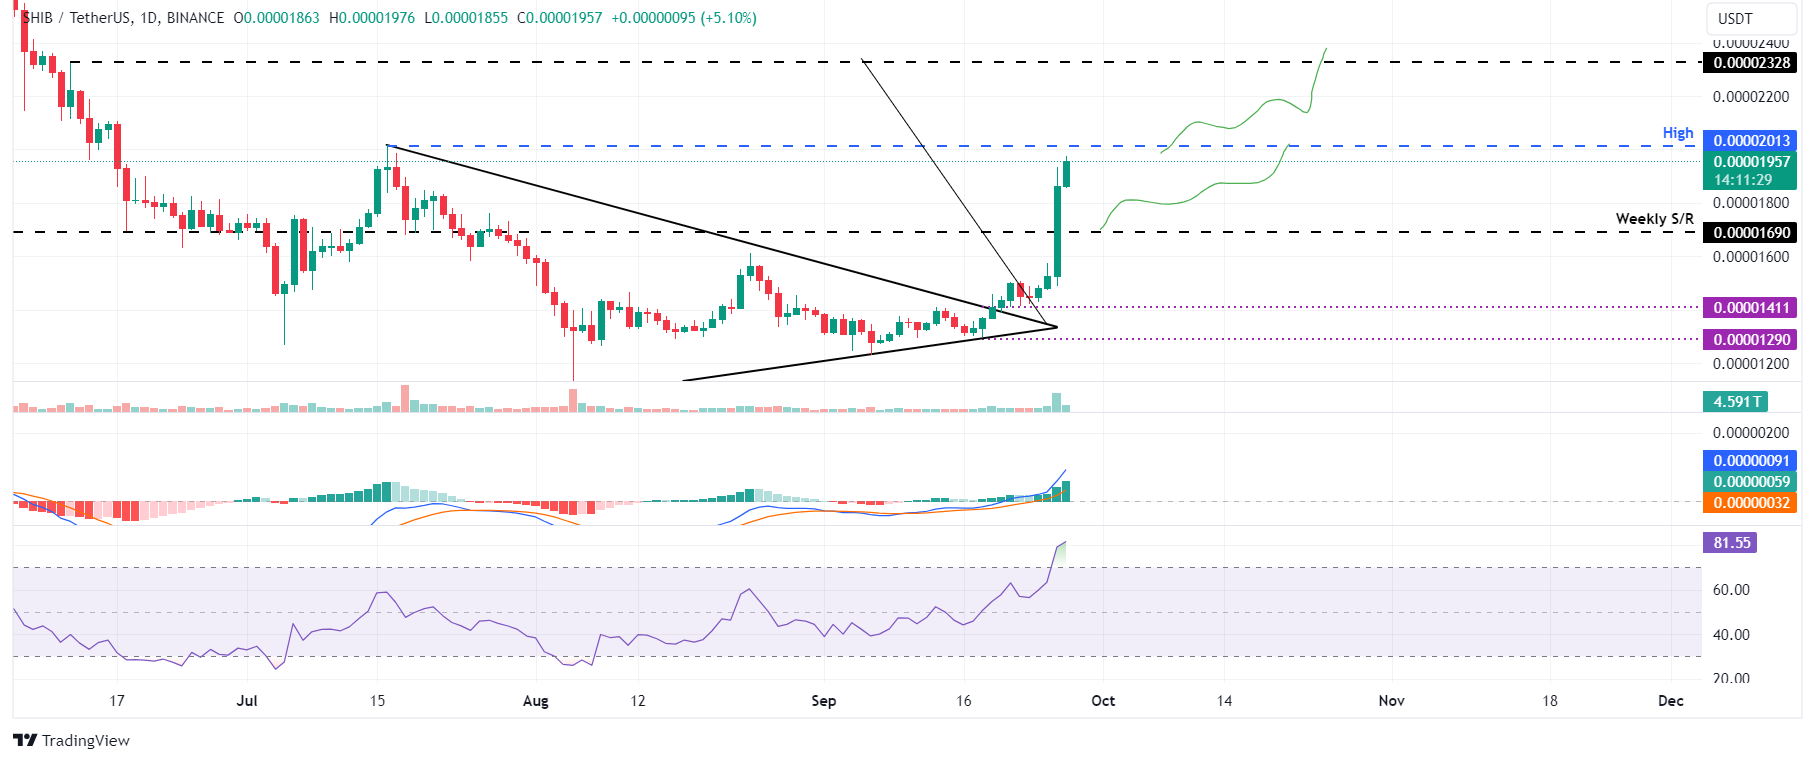
SHIB/USDT daily chart
However, if SHIB’s weekly level at $0.00016 fails to hold and its daily candlestick closes below the breakout level of $0.000014, the market structure would change from bulls to bears. This scenario would extend the decline to retest its September 18 low of $0.000012.
PEPE bulls remain strong
Pepe price broke above the descending trendline (drawn by joining multiple high levels from the end of July to mid-September) on September 20 and rallied 14.5% in the next six days. As of Friday, it continues to trade higher by 12% at $0.0000106, above its 61.8% Fibonacci retracement level at $0.0000104.
If PEPE closes above its 61.8% Fibonacci retracement level at $0.0000104, it could continue to rally 23% from its current trading level to retest its July 24 high of $0.0000131.
The MACD indicator on the daily chart supports PEPE’s price rise after seeing a bullish crossover on September 10. As it is occurring with DOGE and SHIB, green histogram bars are rising above the neutral line zero, which suggests the bulls are in control.
The Relative Strength Index (RSI) stands at 74, trading above its overbought level of 70. Traders should be cautious when adding to their long positions as the chances of a price correction are increasing.
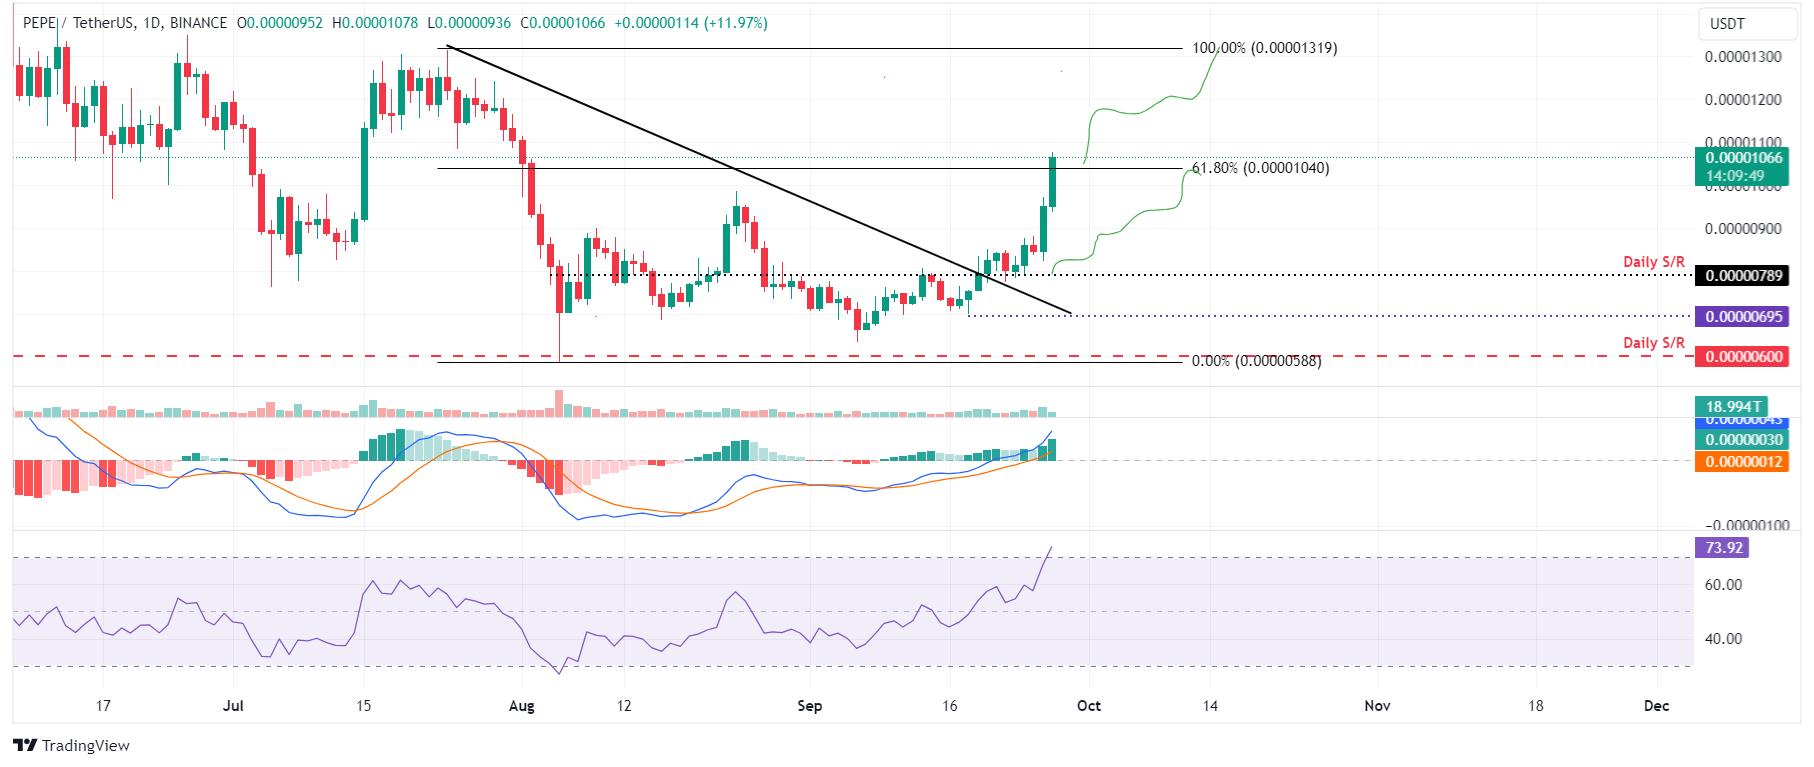
PEPE/USDT daily chart
If Pepe’s daily candlestick closes below $0.0000078, it would form a lower low on the daily time frame, thus invalidating the bullish thesis. This would extend Pepe’s decline to retest its September 18 low of $0.0000069.
Author

Manish Chhetri
FXStreet
Manish Chhetri is a crypto specialist with over four years of experience in the cryptocurrency industry.


