Top 3 gainers NEO, Plume and Story: NEO surges despite Trump's tariff firestorm as investors succumb to extreme fear
- NEO rebounds after touching a five-year low at $4.30 earlier in the week.
- Plume recovery above the 50-day EMA on the backdrop of a rising RSI hints at further gains on Wednesday.
- Story retests February support as investors consider more exposure amid lower prices.
- Trump escalates trade tensions with China ahead of reciprocal tariffs kicking in on Wednesday.

Cryptocurrencies are enduring progressive market carnage from the United States (US) President Donald Trump administration's incessant tariffs on its trade partners, with some selected altcoins like NEO, Plume and Story (IP) leading the bullish brigade on Wednesday. NEO hovers at $5.4 at the time of writing on Wednesday, following a 12% increase in the last 24 hours. Plume and Story surged in tandem, weathering the previous day's pullback, which saw Bitcoin (BTC) drop to $76,198 from highs of $80,823.
Trump tariffs kick in amid extreme fear in crypto
US President Donald Trump's reciprocal tariffs targeting its trade partners take effect on Wednesday despite calls for a pause to allow for negotiations. The global trade war is in full swing, with China being the hardest hit with a massive 104% tariff. The next few weeks will be crucial for global markets, including crypto, especially with the fear & and greed index indicating extreme fear at 18, down from Tuesday’s 28 and the previous week’s 44.
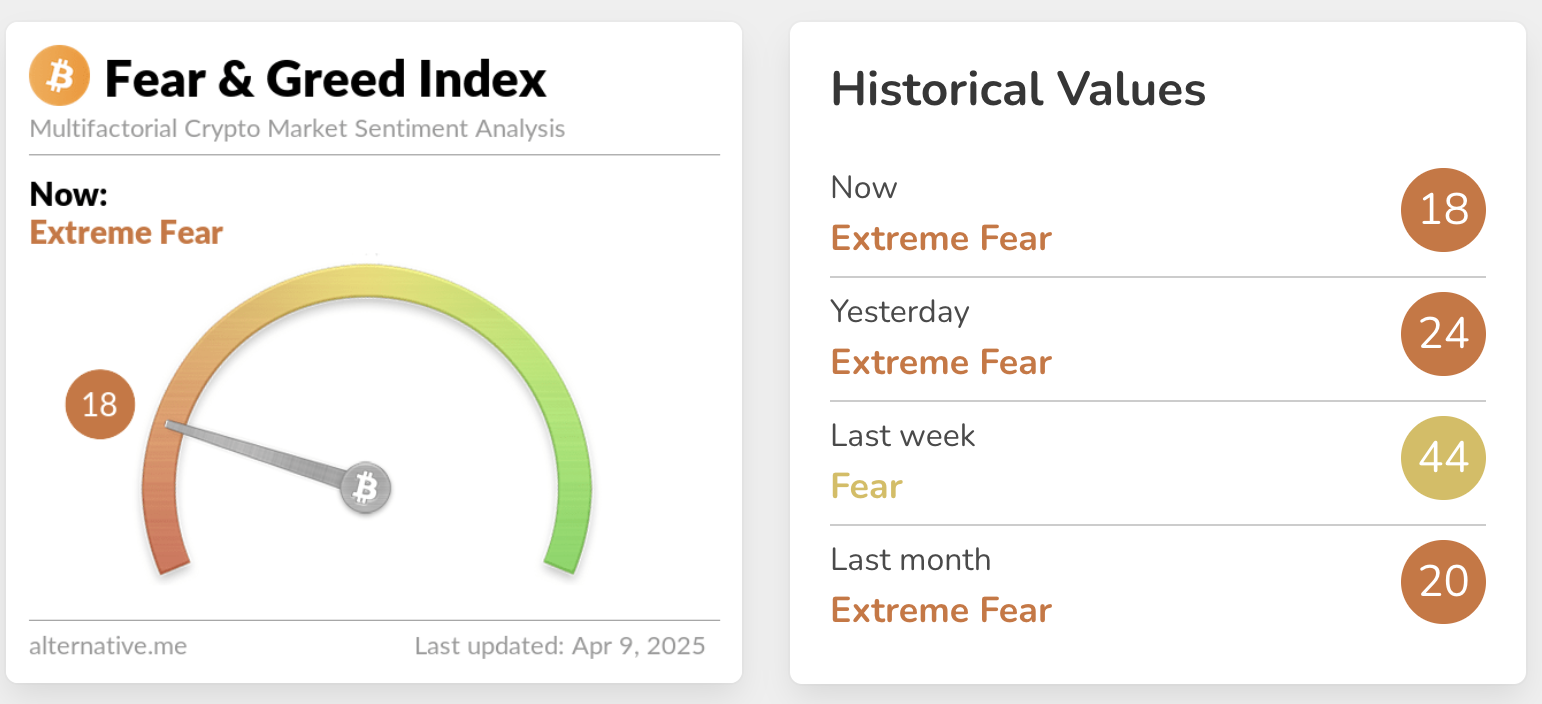
Crypto fear & greed index | Source | Alternative.me
Market participants portray greedy tendencies when the market rises and fear when prices fall. Buying in fearful conditions and selling when most people are greedy is often advisable.
NEO leads altcoin recovery
NEO is the most bullish token in the top 200 on Wednesday after weathering the Trump tariff storm. This storm escalated declines, with NEO reaching a five-year low at $4.30 earlier in the week. Technical indicators in the daily timeframe paint a bullish picture.
A buy signal from the Moving Average Convergence Divergence (MACD) indicator could make NEO more attractive to traders. At the same time, the Relative Strength Index (RSI) affirms the token's upside momentum, lifting from the oversold region into the neutral area.
If investors refrain from taking early profits, NEO has the potential to tackle resistance at $6.00 and subsequently breach the descending trendline and the 50-day Exponential Moving Average (EMA).
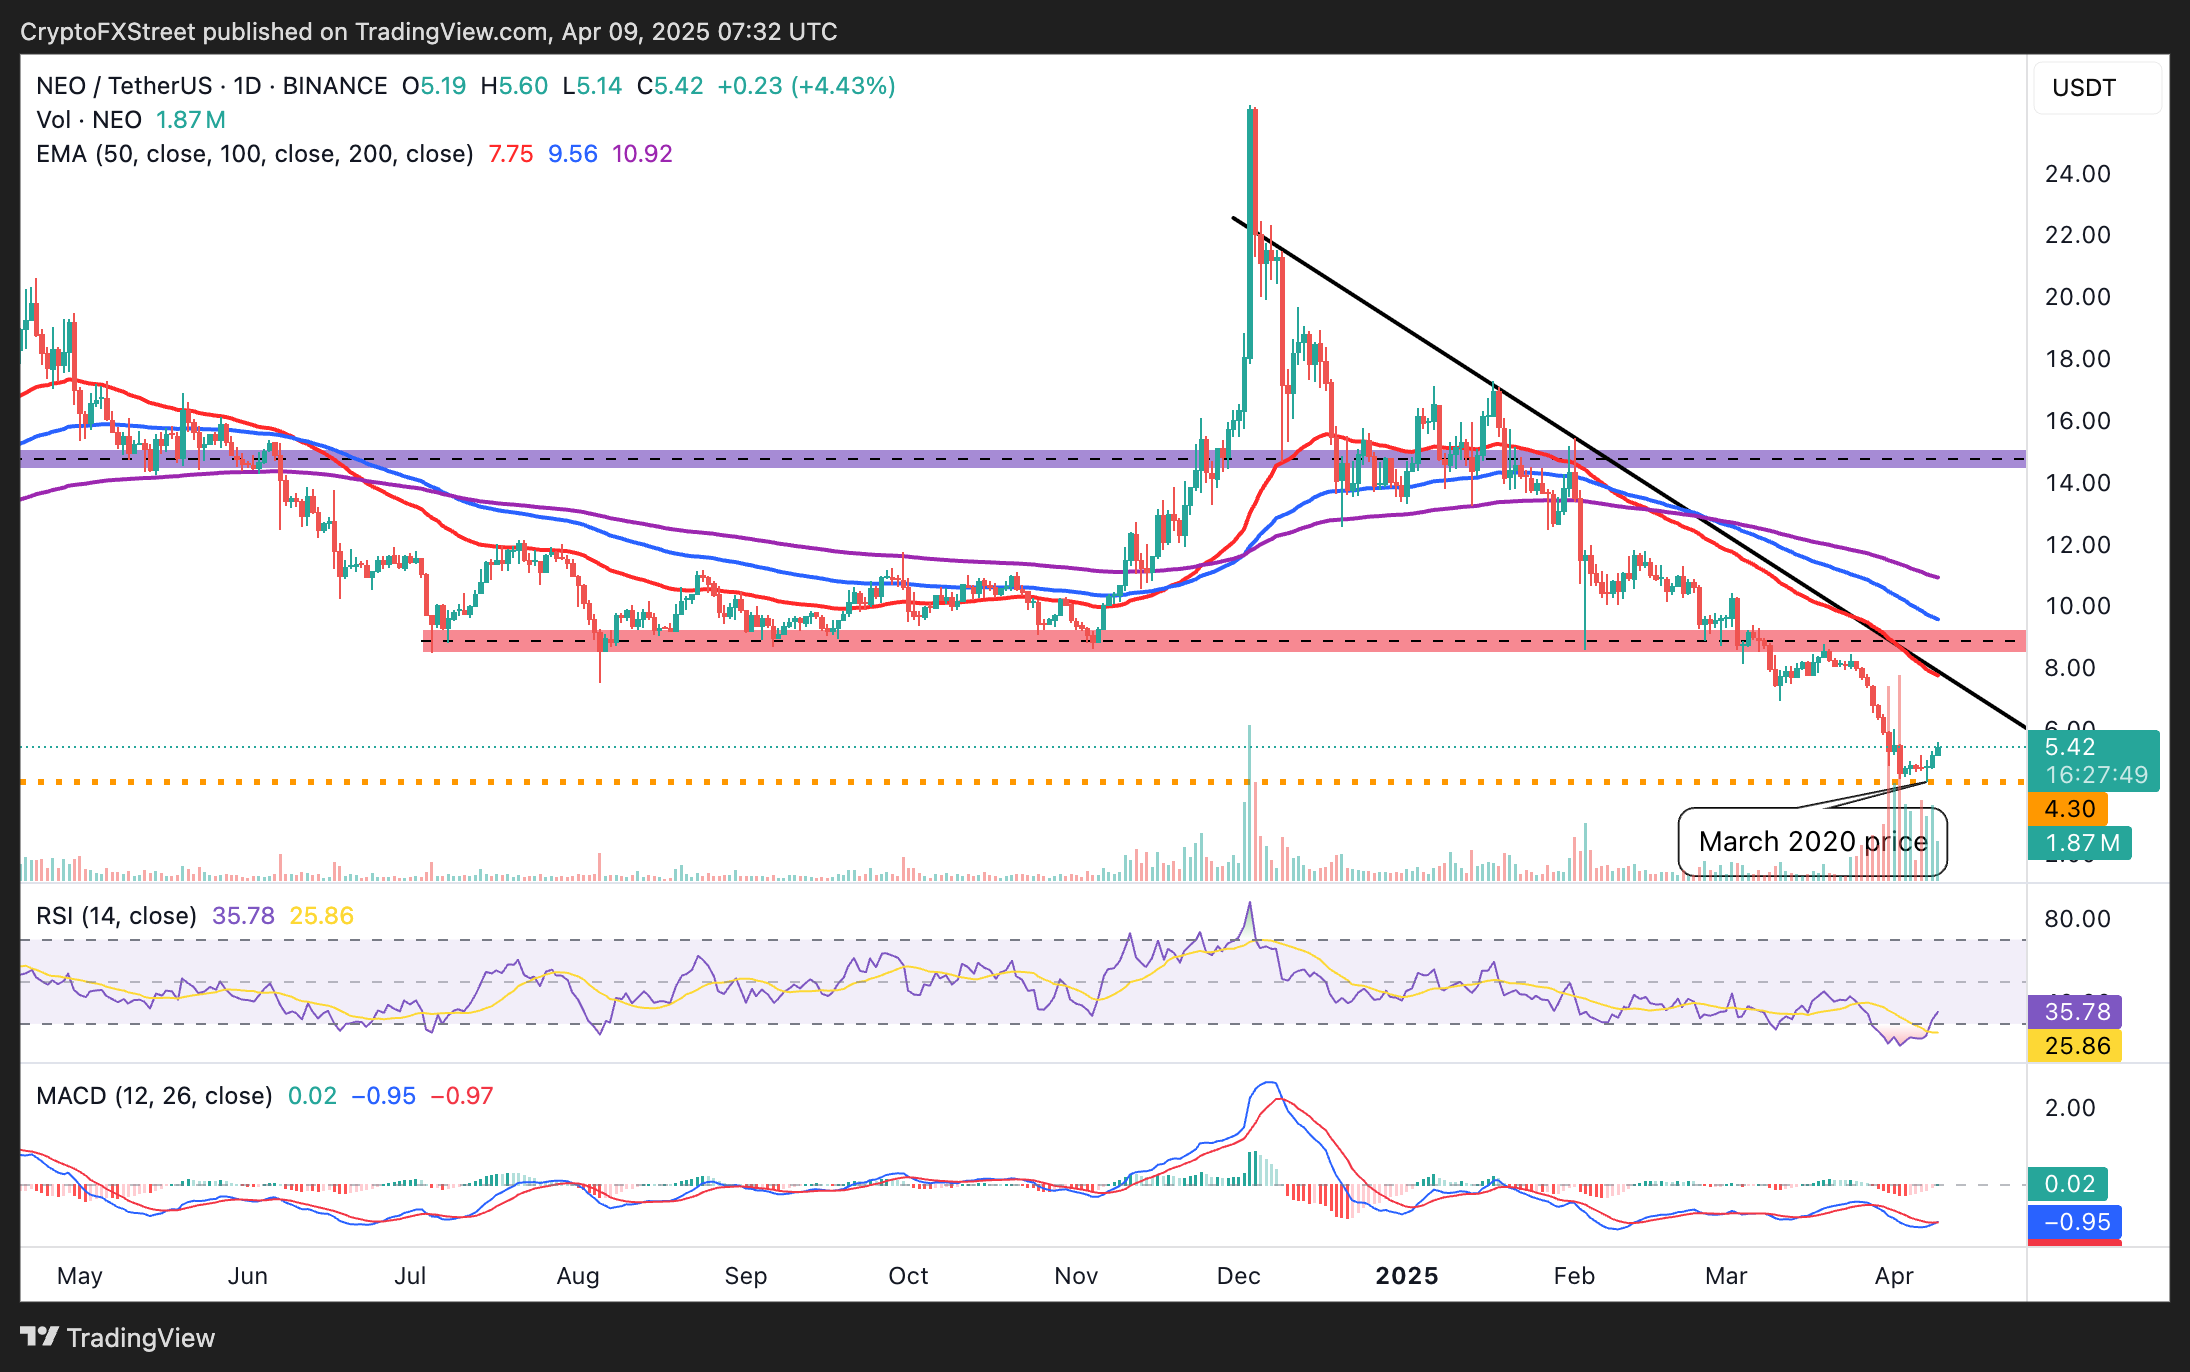
NEO/USDT daily price chart
Like other crypto assets, NEO faces macroeconomic uncertainty as trade tensions mount, not to mention the fear of a recession in the US in 2025. These evolving factors may hinder NEO's short-term and midterm growth.
Plume gains target $0.2
Plume recovers by 25% from Monday’s low of $0.1313 and trades at $0.1671 at the time of writing on Wednesday. Before last week's breakdown, Plume sustained a downtrend from its March 19 all-time high of $0.2479.
The smart contracts token sits above the 50-day EMA after flipping resistance around $0.1600 (red in the chart). Traders should watch out for a potential buy signal from the MACD for another uptrend confirmation.
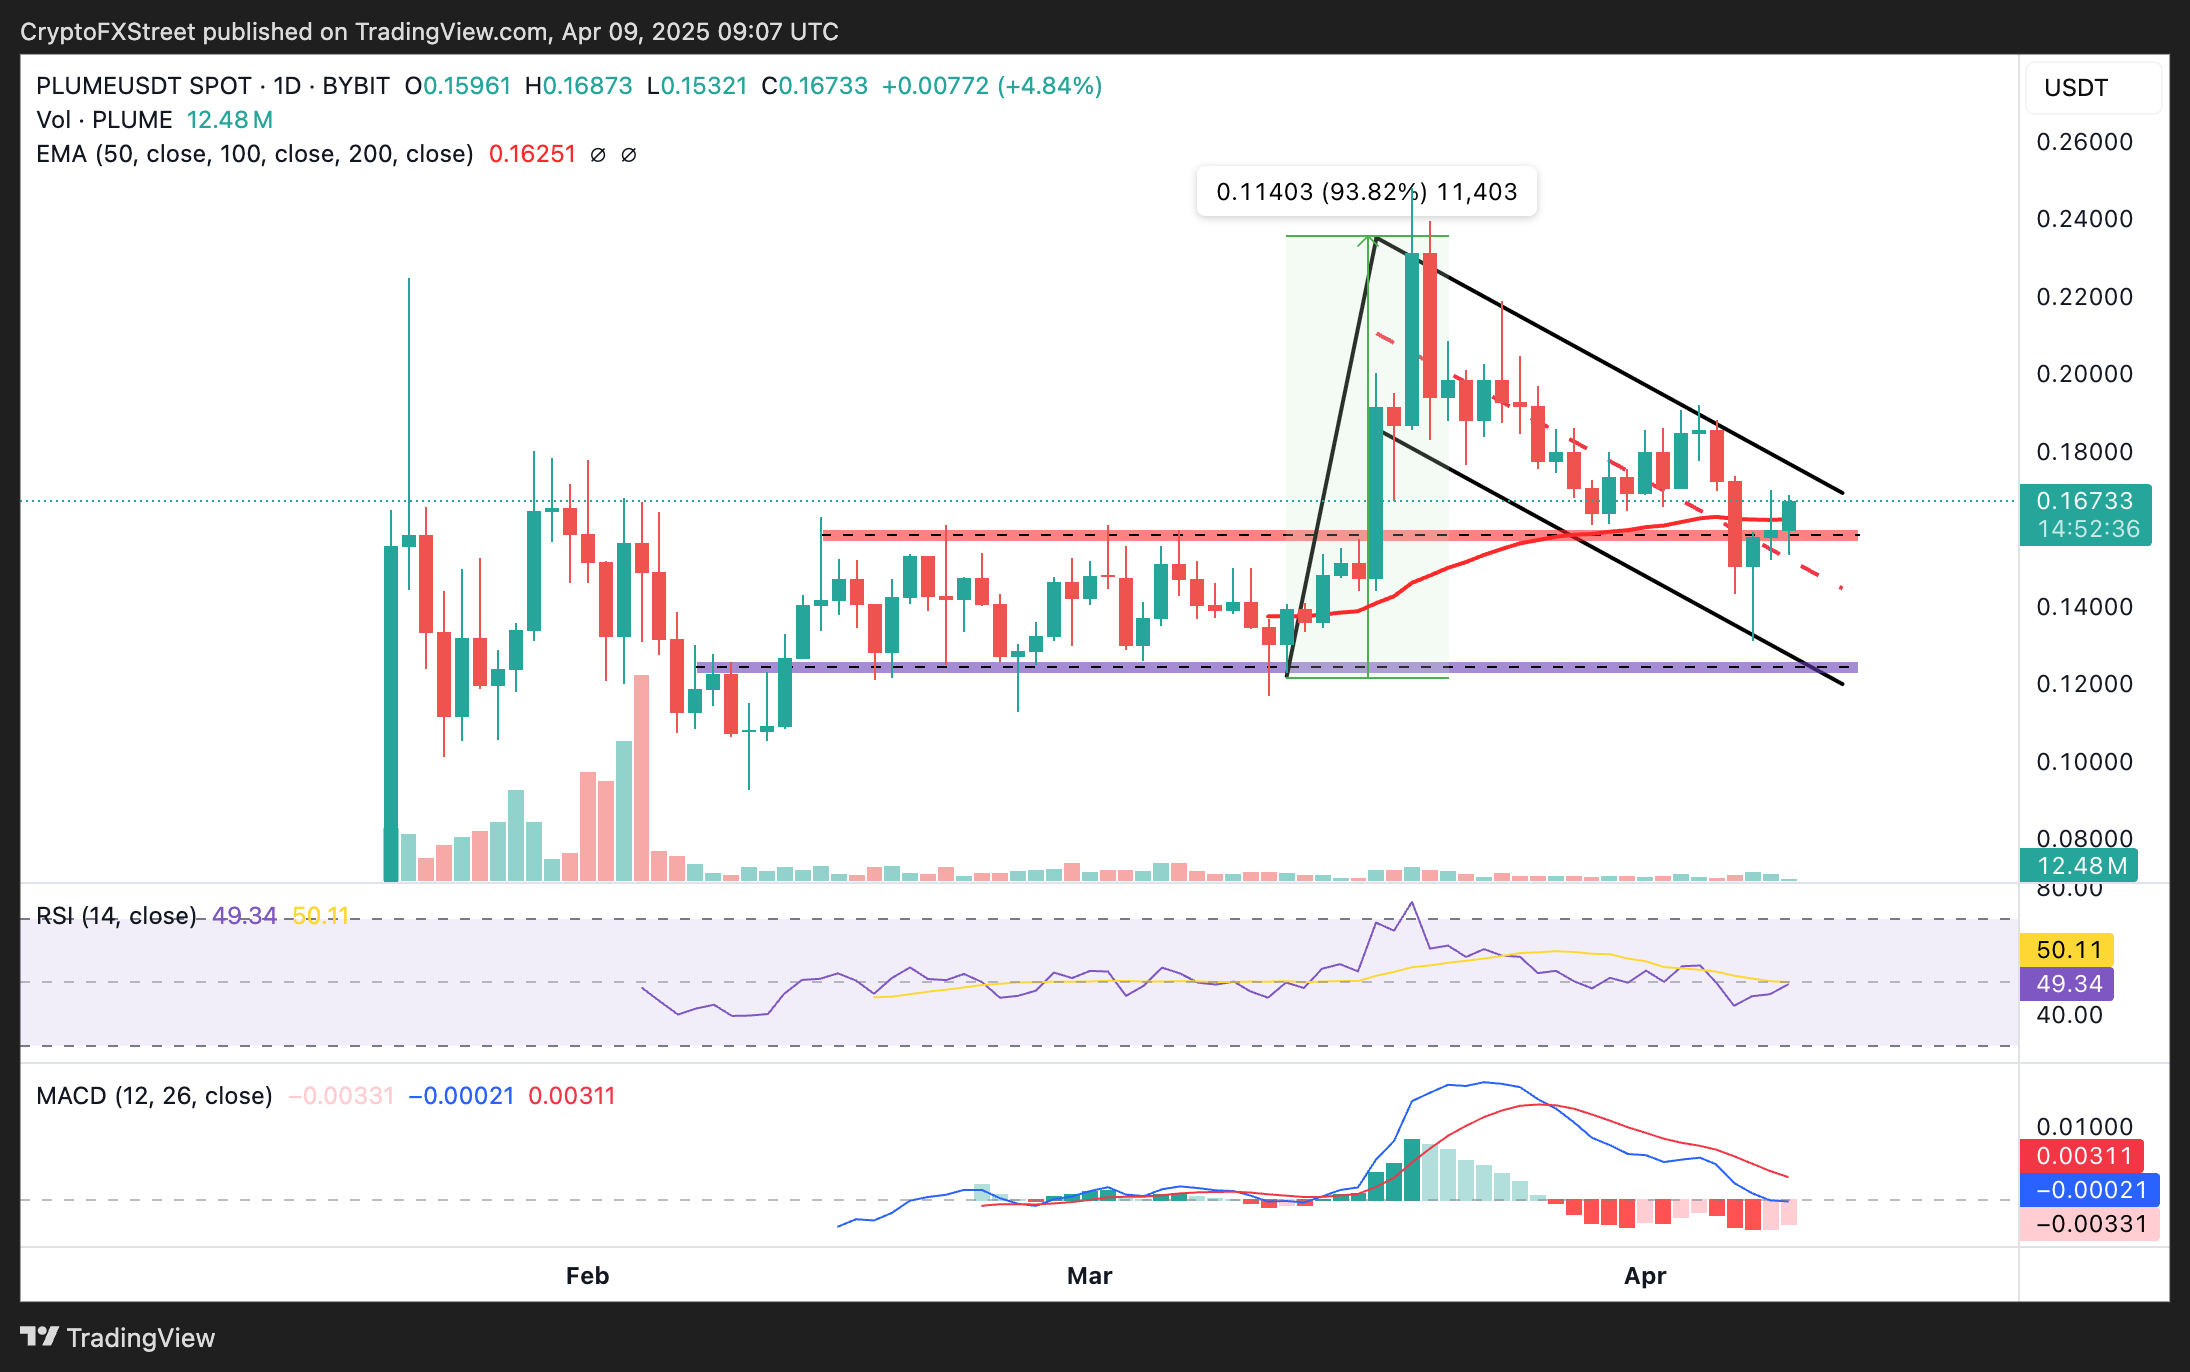
PLUME/USDT daily chart
Looking ahead, a bull flag pattern in the daily chart could boost the bullish momentum by 46.91%, representing half the length of the flagpole extrapolated above the breakout point. Such a move would put PLUME slightly above the current all-time highs.
Story calm after the storm
Story price stabilizes at $4.2290 during the European session on Wednesday. It boasts a 6.1% increase in the past 24 hours while facing a 32.7% drawdown in a fortnight. According to the daily chart, IP's February support of around $3.9000 has played a crucial role, absorbing sell-side pressure and paving the way for gains targeting the $5.0000 level in the short term.
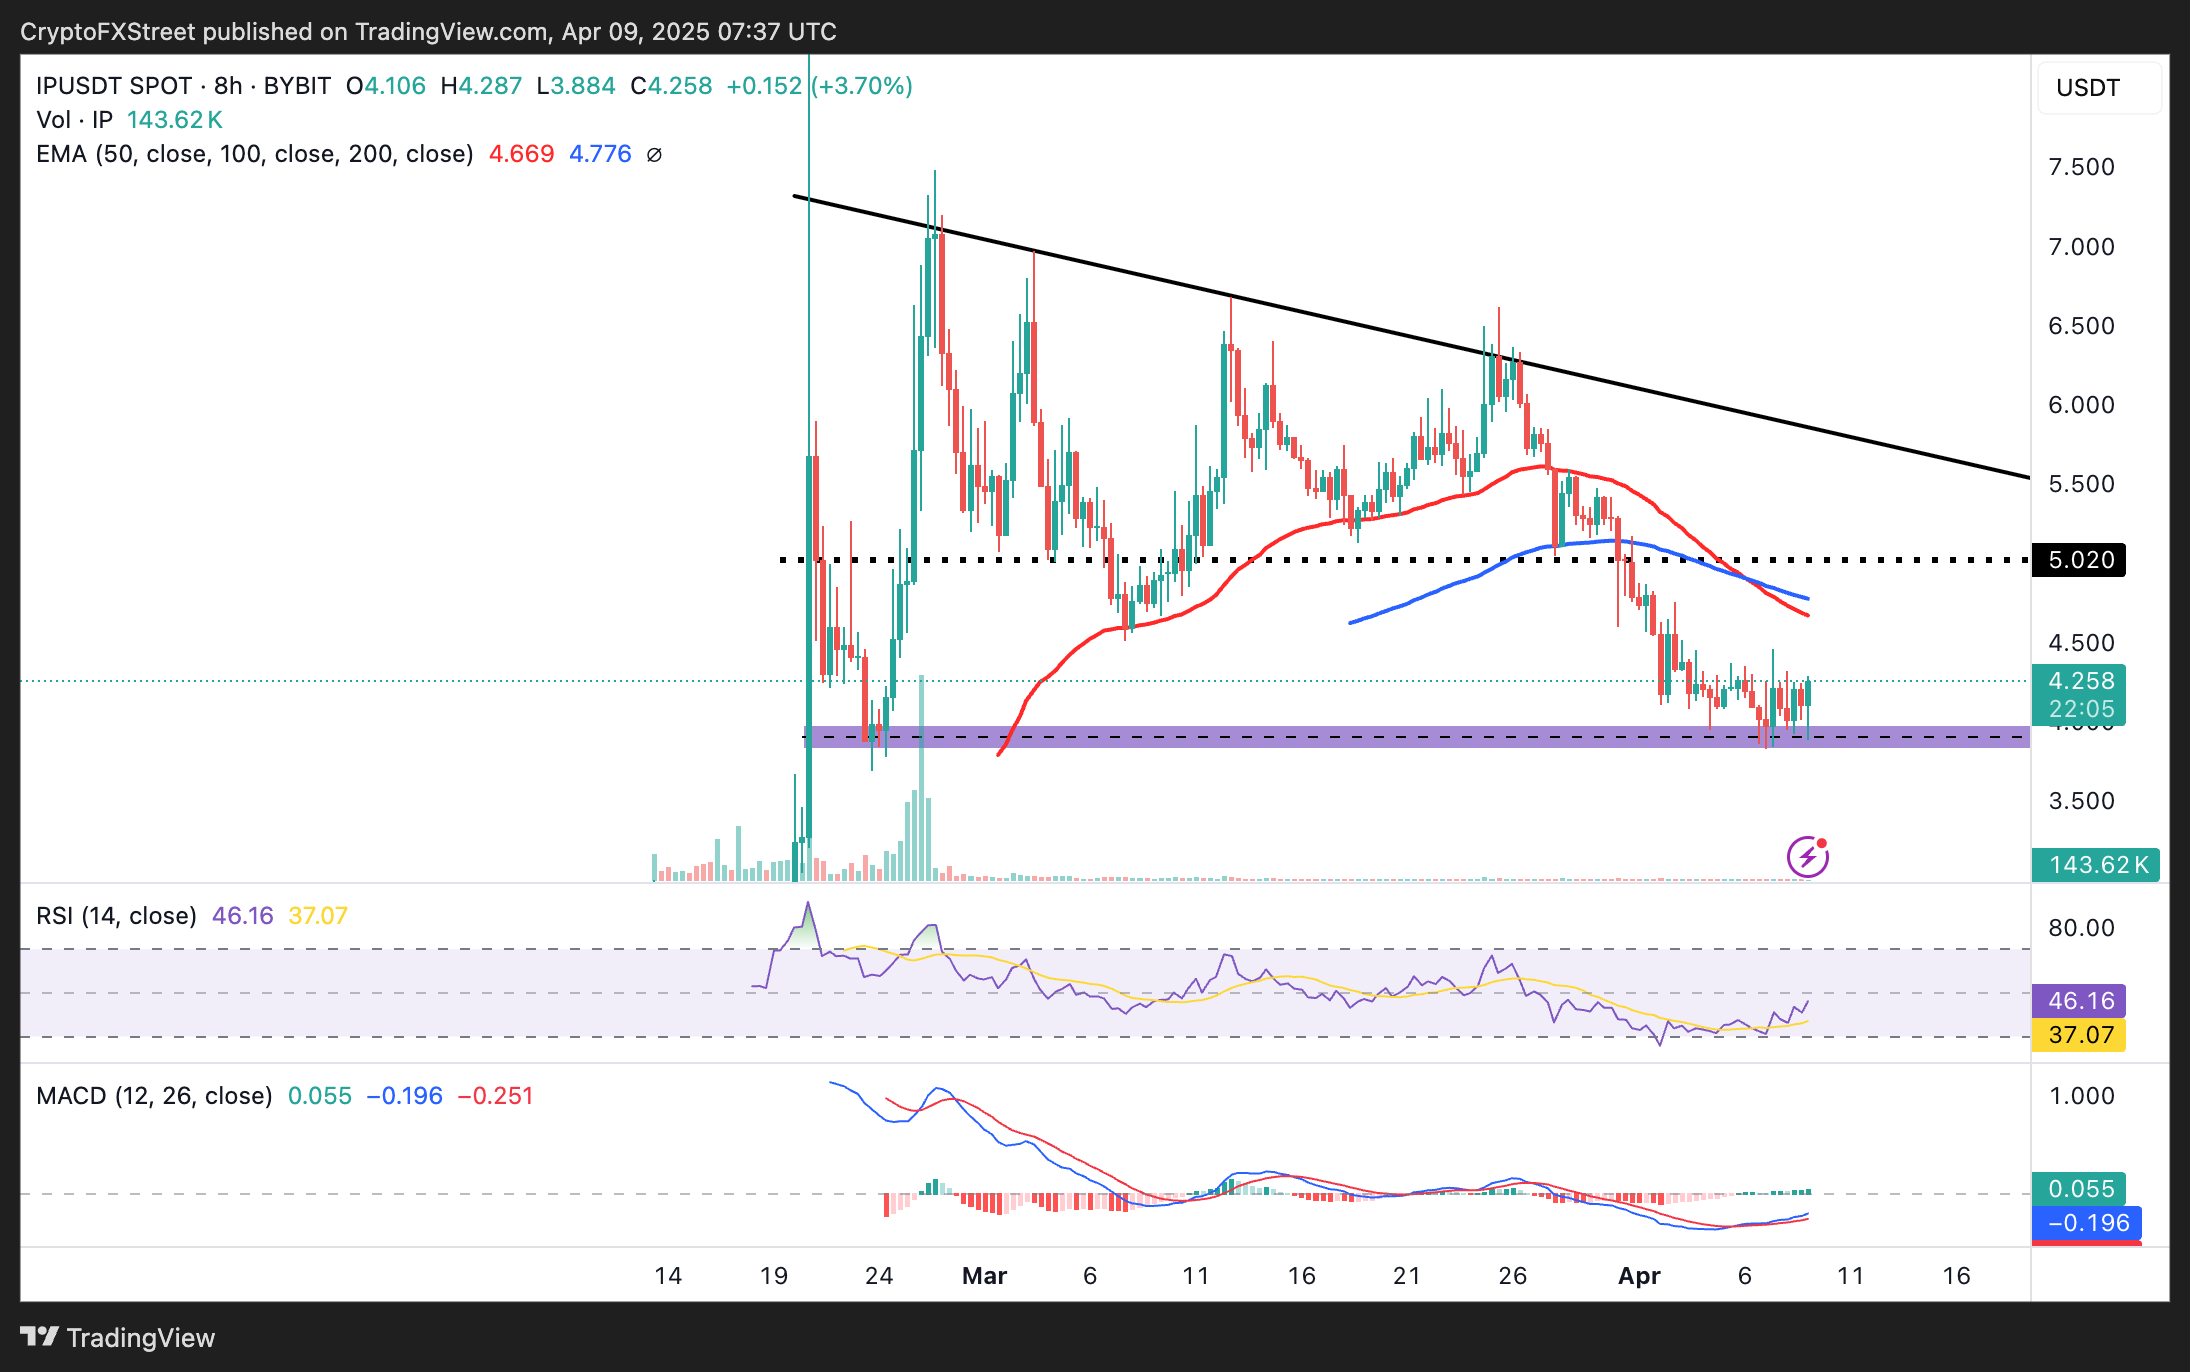
IP/USDT daily chart
The RSI encourages traders to seek more exposure as it changes course upward above 40. However, there's potential sell-side pressure at $4.5000, where some traders could place sell orders to profit from buying the dip. If IP fails to sustain the recovery and slides below the primary support (purple), declines could extend to $3.0000.
Author

John Isige
FXStreet
John Isige is a seasoned cryptocurrency journalist and markets analyst committed to delivering high-quality, actionable insights tailored to traders, investors, and crypto enthusiasts. He enjoys deep dives into emerging Web3 tren


