Dogecoin is set for a rally if it breaks above falling wedge pattern
- Dogecoin price trades inside a falling wedge pattern, breakout would signal a bullish move ahead.
- On-chain data shows a bullish outlook as DOGE’s dormant wallets are active and the long-to-short ratio is above one.
- A daily candlestick close below $0.088 would invalidate the bullish thesis.

Dogecoin (DOGE) is approaching the upper trendline of the falling wedge pattern on Friday, and a breakout would suggest a rally in the making. The bullish outlook for the dog-themed meme coin is further supported by reactivated dormant wallets and a long-to-short ratio above 1.
Dogecoin price looks promising
Dogecoin price is approaching the upper trendline of the falling wedge pattern. This pattern is formed by connecting multiple high and low levels with a trendline from early March. As of Friday, it trades at around $0.106.
Suppose DOGE breaks above the upper trendline and closes above the 50-day Exponential Moving Average (EMA) around $0.106. That breakout would signal an uptrend. Dogecoin could rally 33% from its current trading level to retest its daily resistance at $0.141.
The Moving Average Convergence Divergence (MACD) indicator, which shows a bullish crossover on the daily chart, further supports Dogecoin’s bullish outlook. The MACD line (blue line) trades above the signal line (yellow line), suggesting the bulls are buying. Additionally, it shows rising green histogram bars above its neutral line zero, indicating bullish momentum.
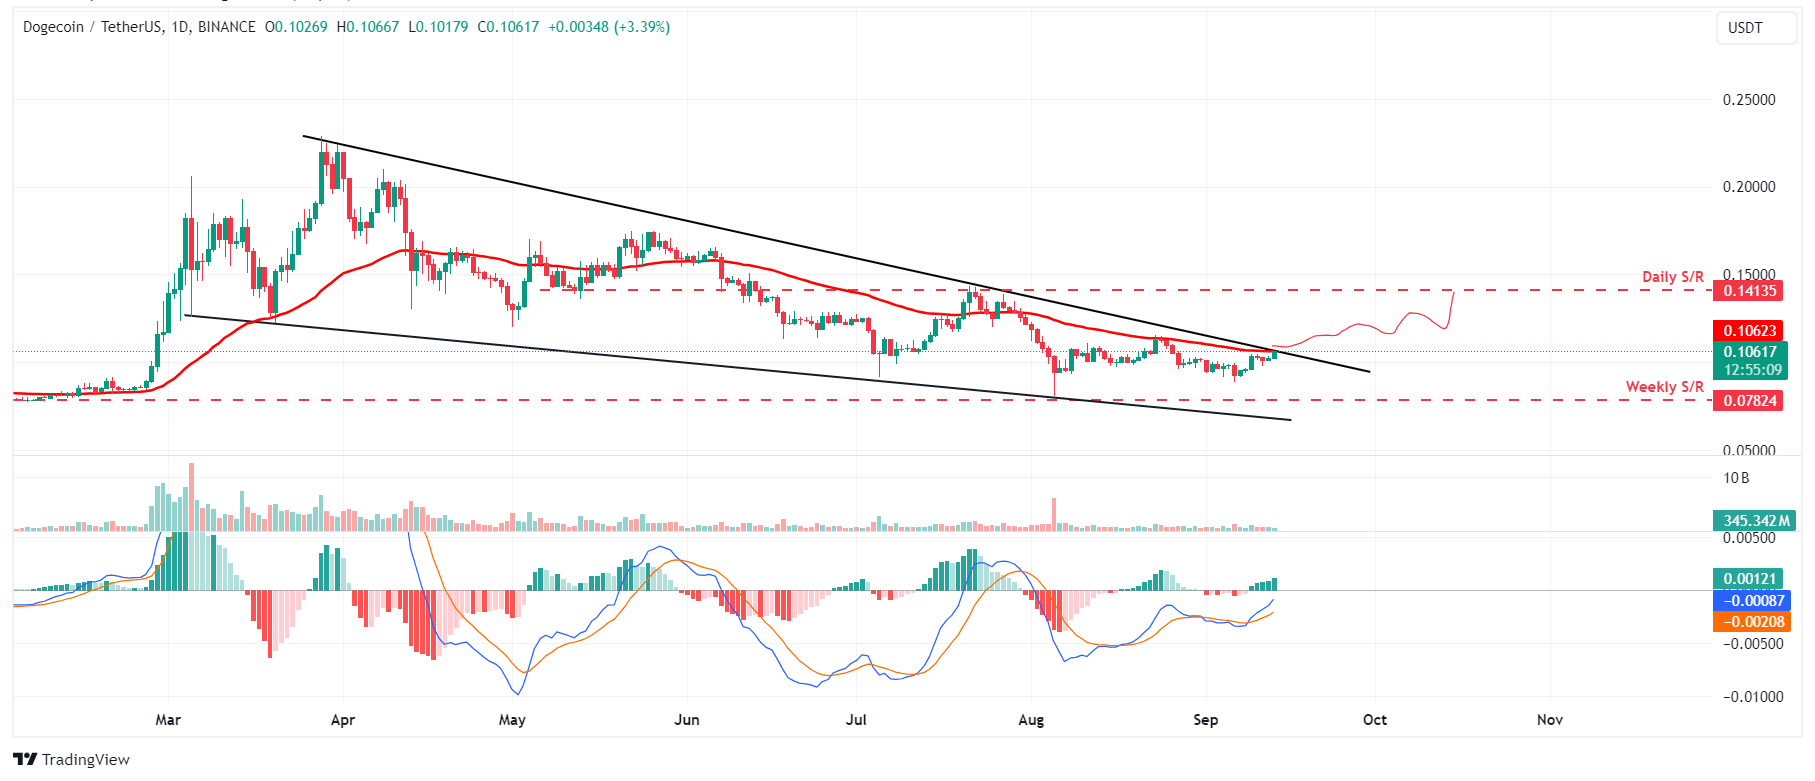
DOGE/USD daily chart
Looking into on-chain data further aligns with the bullish outlook. Coinglass’ DOGE long-to-short ratio stands at 1.16, the highest level in almost one month and flipping above 1 on Friday. This means more traders are betting on the asset’s price to rise.
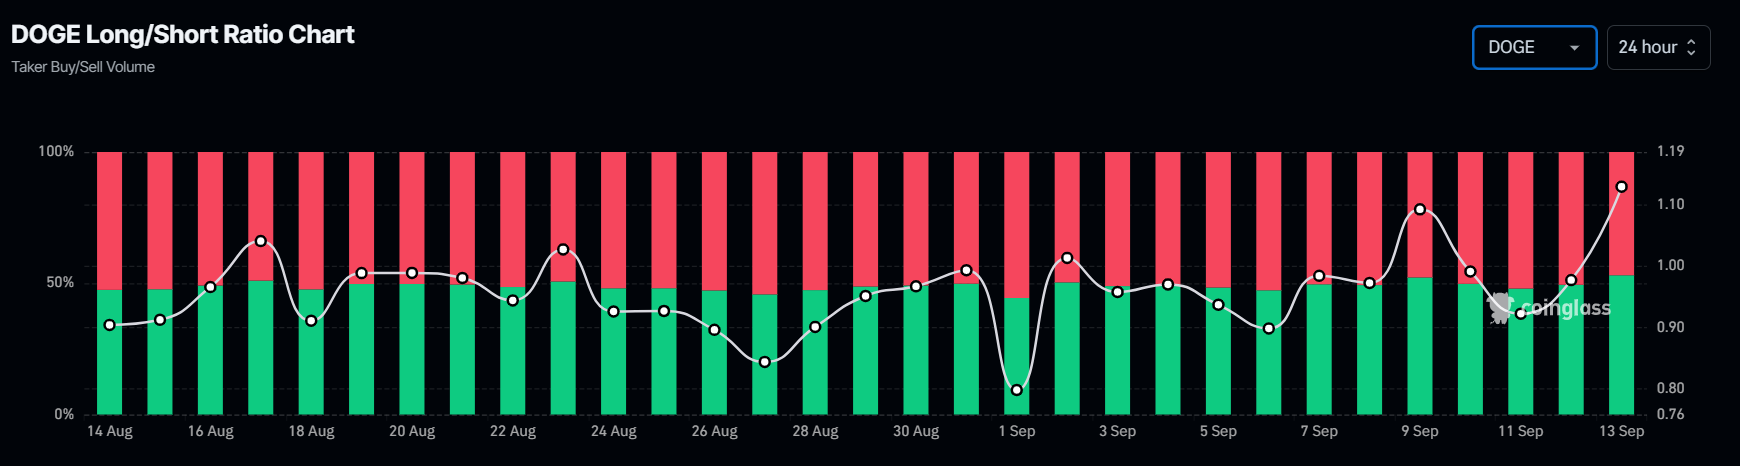
DOGE long-to-short ratio chart
Additionally, Santiment’s Age Consumed index is in line with the bullish outlook noted from a technical perspective. The spikes in this index suggest dormant tokens (tokens stored in wallets for a long time) are in motion and can be used to spot short-term local tops or bottoms.
For DOGE, history shows that the spikes are generally followed by a rally in Dogecoin price. The most recent uptick on August 7 also forecasted that the dog-themed meme coin was ready for an uptrend.
%20[16.39.04,%2013%20Sep,%202024]-638618336319363168.png)
DOGE’s Age Consumed Index chart
Despite the bullish projection shown by the technical analysis and on-chain metrics, if Dogecoin’s daily candlestick closes below $0.088, it would invalidate the bullish thesis. This scenario would crash Dogecoin’s price by 11% to retest its weekly support at $0.078.
Author

Manish Chhetri
FXStreet
Manish Chhetri is a crypto specialist with over four years of experience in the cryptocurrency industry.


