Pepe price forecast: Eyes for 30% rally
- Pepe’s price broke and closed above the descending trendline on Thursday, eyeing for a rally.
- On-chain data hints at a bullish move as PEPE’s dormant wallets are active, and the long-to-short ratio is above one.
- A daily candlestick close below $0.0000069 would invalidate the bullish thesis.

Pepe (PEPE) extends the upward movement on Friday after breaking above the descending trendline and resistance barrier on Thursday. PEPE’s dormant wallets are in motion, and the long-to-short ratio is above one, further supporting this bullish move and hinting at a rally on the horizon.
Pepe price shows potential for a rally
Pepe price broke above the descending trendline (drawn by joining multiple high levels from the end of July to mid-September) and closed above the daily resistance level of $0.0000078 on Thursday. At the time of writing on Friday, it continues to trade higher at around $0.0000083.
If PEPE’s price establishes support near the trendline breakout level, with the previous daily resistance around $0.0000078 acting as support, it could rally 30% to restest its 61.8% Fibonacci retracement level at $0.0000104 (drawn from the July high to the August low).
The Moving Average Convergence Divergence (MACD) indicator further supports PEPE’s rise, signaling a bullish crossover on the daily chart. The MACD line (blue line) moved above the signal line (yellow line), giving a buy signal. Furthermore, the Relative Strength Index (RSI) trades above its neutral level of 50 and tilts higher, indicating strong bullish momentum.
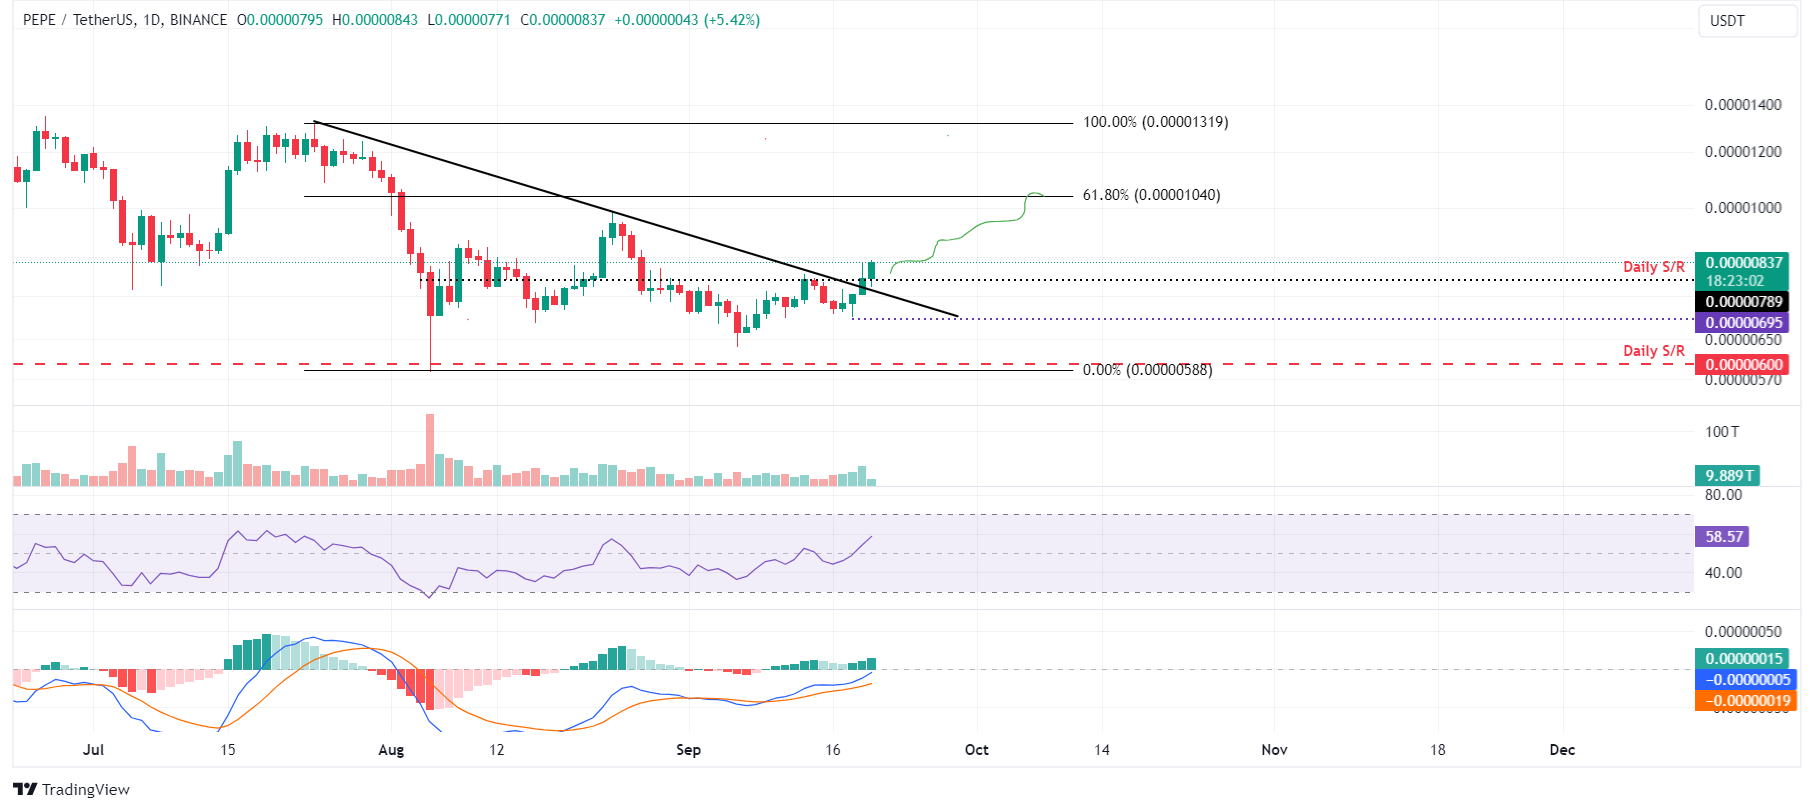
PEPE/USDT daily chart
PEPE’s on-chain data further supports the bullish thesis. Coinglass’s long-to-short ratio is 1.08, the highest level in one month. This indicates that more traders are betting for the asset’s price to rise.
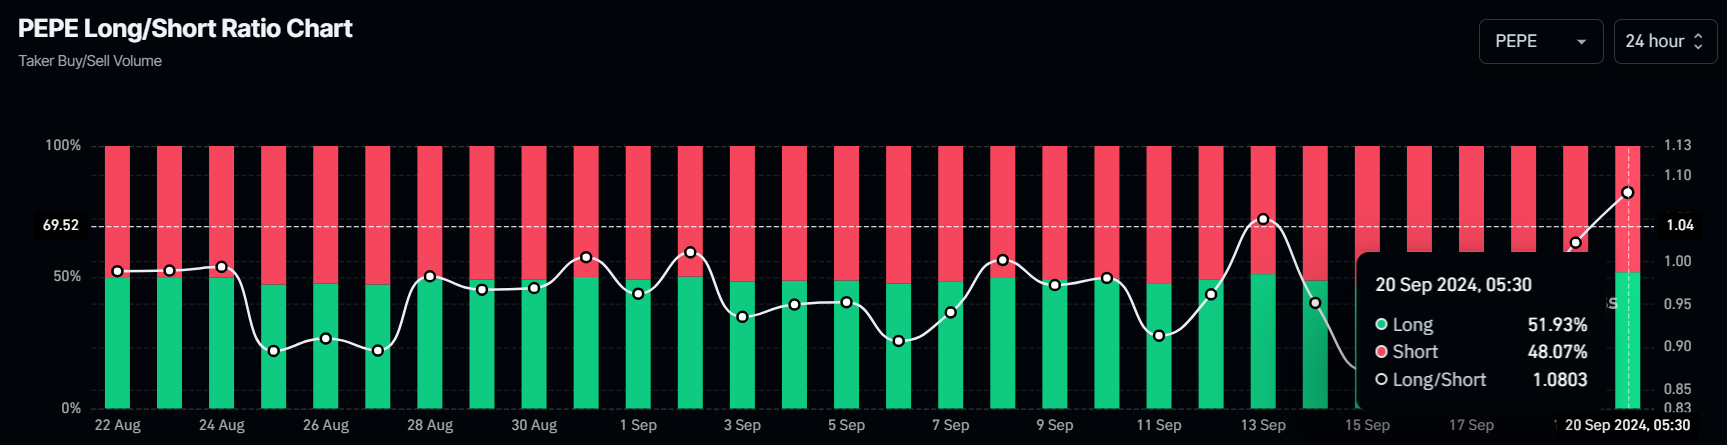
PEPE long-to-ratio chart
Additionally, Santiment’s Age Consumed index aligns with the bullish outlook. The spikes in this index suggest dormant tokens (tokens stored in wallets for a long time) are in motion and can be used to spot short-term local tops or bottoms.
For PEPE, history shows that those spikes were followed by a rally in Pepe’s price. The most recent uptick on September 10 also forecasted that PEPE was ready for an uptrend.
%20[11.05.27,%2020%20Sep,%202024]-638624120339119093.png)
PEPE Age Consumed index chart
However, If Pepe’s daily candlestick closes below $0.0000069, it would form a lower low on the daily time frame, thus invalidating the bullish thesis. This development would reduce Pepe’s price by 13% to retest the daily support at $0.0000060.
Author

Manish Chhetri
FXStreet
Manish Chhetri is a crypto specialist with over four years of experience in the cryptocurrency industry.


