Top 3 Price Prediction Bitcoin, Ethereum, Ripple: Bitcoin surges past $65,000, sets sights on $70,000
- Bitcoin broke above its range upper limit of $64,700, eyeing a rally ahead.
- Ethereum price finds support around its 50-day EMA level of around $2,600, signaling an upswing on the horizon.
- Ripple price consolidates between $0.560 and $0.613, indicating a phase of uncertainty.

Bitcoin (BTC) broke above its consolidation zone, signaling a potential bullish move ahead. At the same time, Ethereum (ETH) is finding support at a key level, hinting at an upcoming rally. In contrast, Ripple (XRP) consolidates between its crucial levels, indicating a period of indecision among traders.
Bitcoin price is poised for a rally if it sustains above its resistance barrier
Bitcoin price broke and closed above its consolidation zone between $62,000 and $64,700 on Thursday, closing above $65,000. As of Friday, it is trading slightly lower, around $64,900, after encountering resistance at the daily level of $65,379.
If BTC breaks and closes above its daily resistance level at $65,379, it could rally 7% from the breakout point to retest its July 29 high of $70,079.
The Relative Strength Index (RSI) on the daily chart has declined slightly and is currently pointing downward, trading at 64. For Bitcoin to continue its rally, the RSI must rise and head towards 70. However, traders should be cautious if it exceeds the overbought level 70.
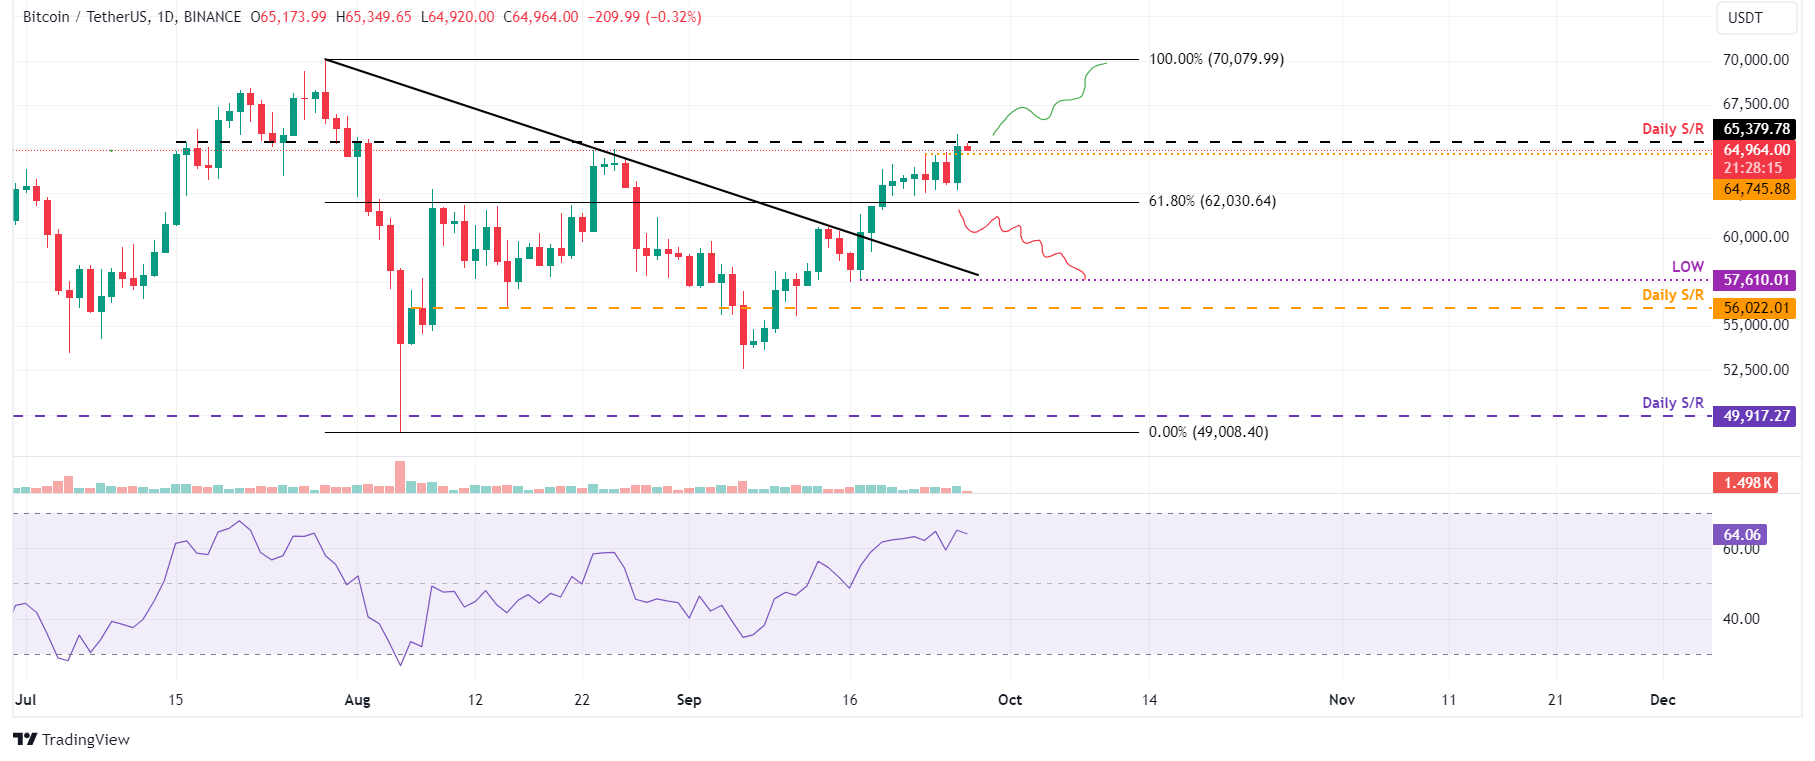
BTC/USDT daily chart
On the other hand, if BTC breaks and closes below the consolidation zone around $62,000, it could extend the decline by 7% to retest its September 17 low of $57,610.
Ethereum finds support at key level, eyeing potential rally ahead
Ethereum price is trading around its 50-day Exponential Moving Average (EMA) at $2,594 on Friday. It found support after breaking above its descending trendline on September 19, which led to an 11% rally.
If the 50-day EMA at $2,594 support holds, ETH could continue its rally to retest its August 24 high of $2,820.
The RSI on the daily chart is trading lower near the 57 level, reflecting the decrease in the bullish momentum. For the rally to be sustained, the RSI must rise above 60, which generally indicates that bulls are gaining traction.
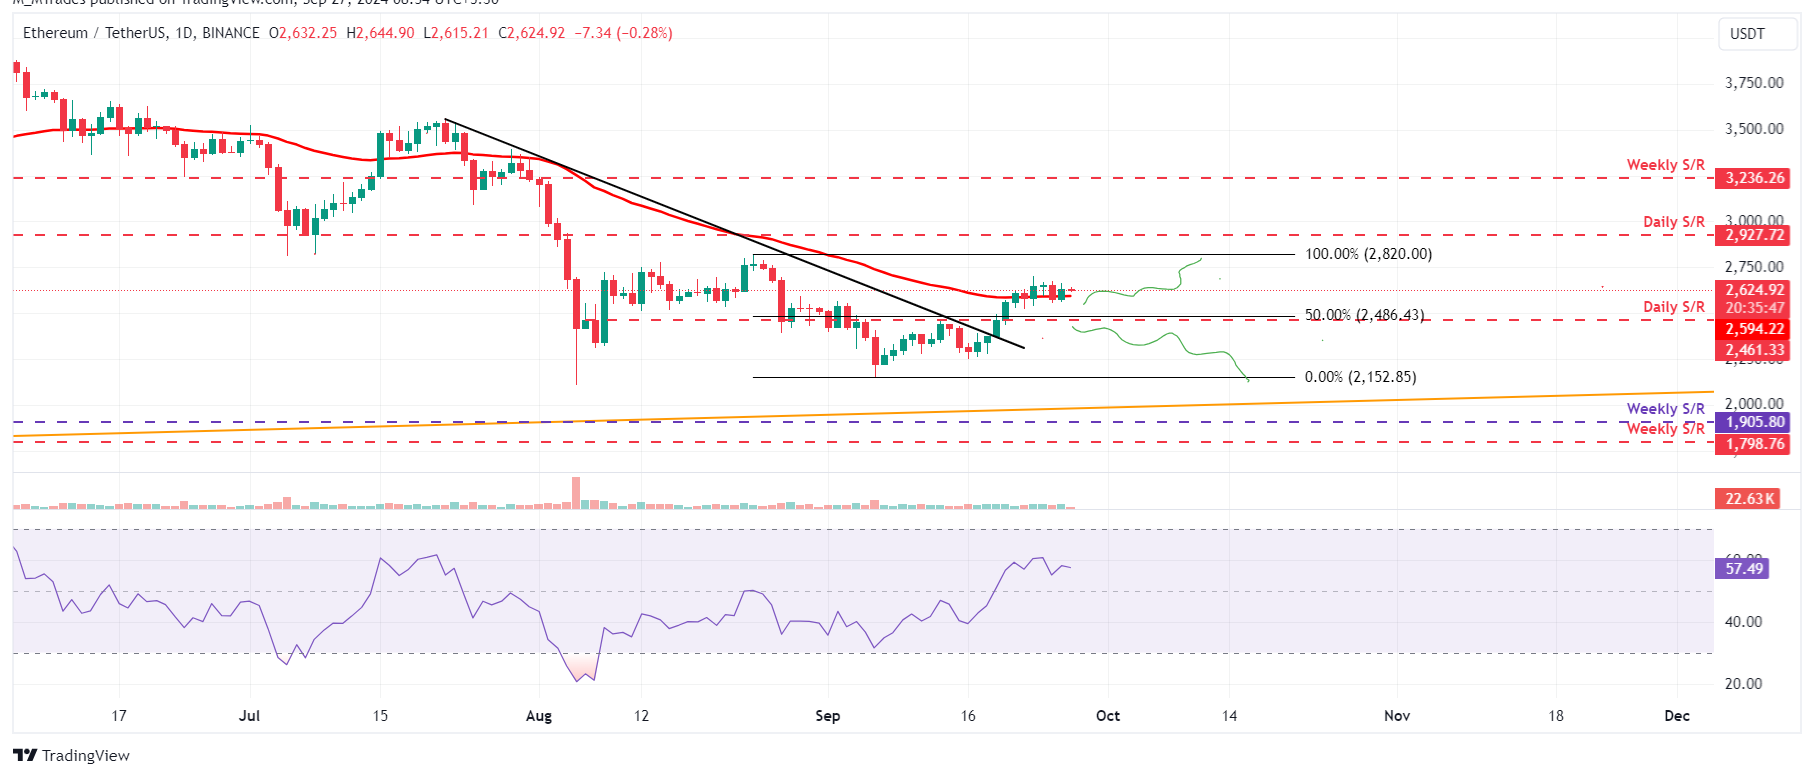
ETH/USDT daily chart
However, if the 50-day EMA fails to hold and Ethereum price declines, closing below the daily support level of $2,461, it could decline further to retest its September 6 low of $2,152.
Ripple price consolidates between two key levels
Ripple price has been trading above its ascending trendline (drawn by connecting multiple low levels from July 5) and consolidating between the $0.560 and $0.613 key levels for over two weeks. As of Friday, it trades at around $0.586.
If Ripple breaks above this consolidating range around $0.613, it could first rise to retest its daily resistance level at $0.626. A daily close above this level could extend the rise by 5% to retest its July 31 high of $0.658.
The RSI on the daily chart trades above its neutral level of 50 and is hovering around 53. For the rally to be sustained, the RSI must rise above 60, which indicates that bulls are getting strong for the uprise.
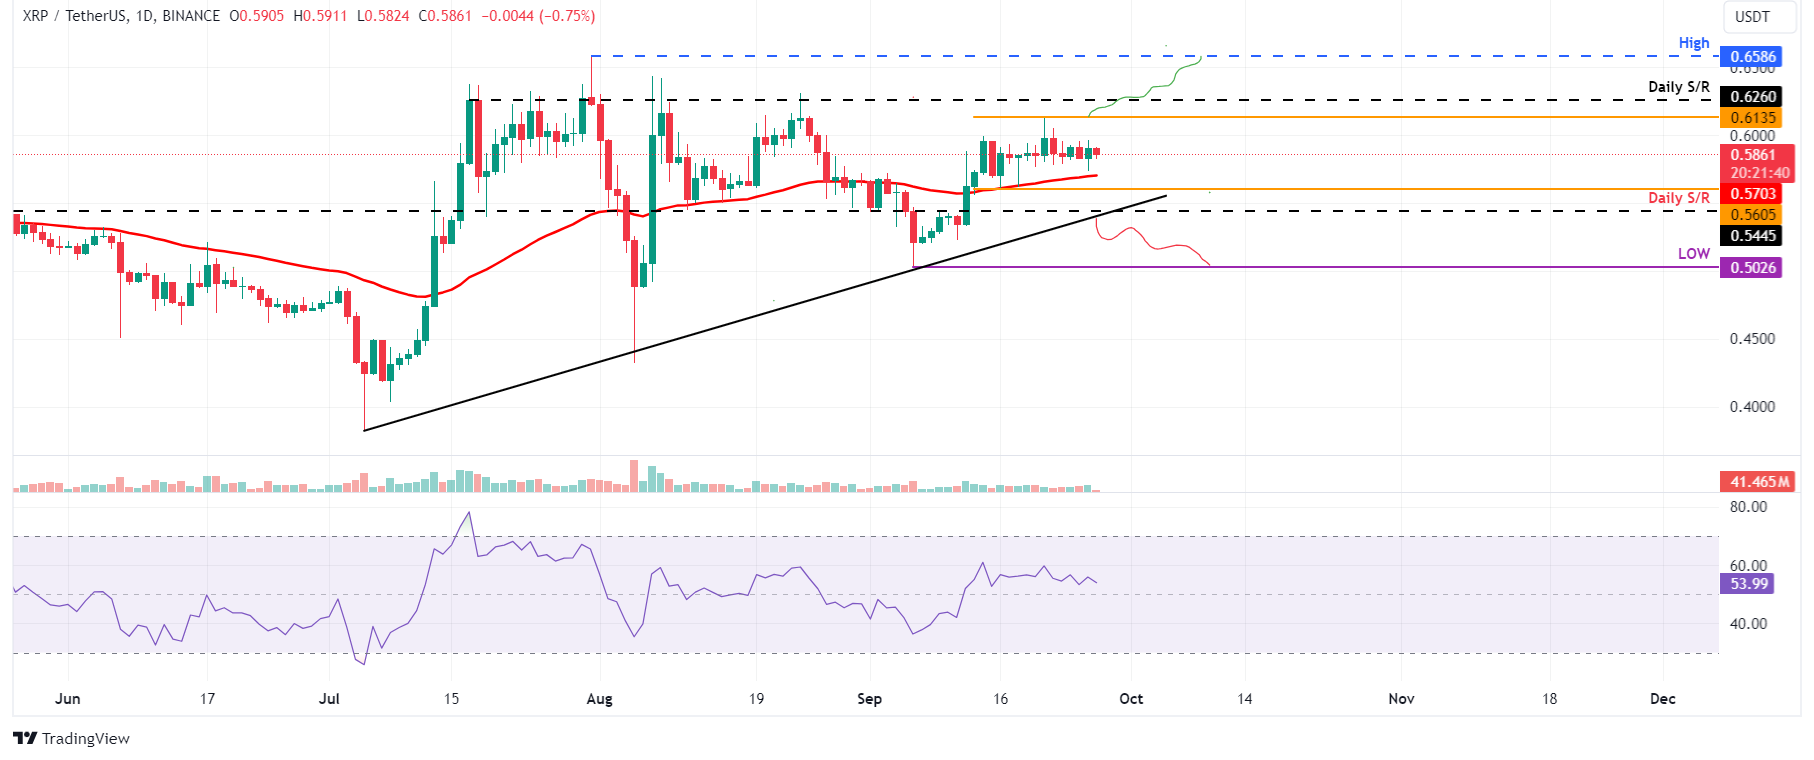
XRP/USDT daily chart
However, if Ripple’s price breaks below the consolidation zone around $0.560 and closes below the $0.544 daily support level, it would also break below the ascending trendline, changing the market structure to bearish. In such a case, XRP would decline 7.5% to retest its September 6 low of $0.502.
Author

Manish Chhetri
FXStreet
Manish Chhetri is a crypto specialist with over four years of experience in the cryptocurrency industry.


