Litecoin Price Analysis: LTC recovery to $180 could be an uphill battle – Confluence Detector
- Litecoin retest support at $150 following rejection from the yearly high at $181.
- On-chain data shows that recovery back to $180 will be challenging, especially with a high seller concentration at $170.

Litecoin was rejected from levels above $170 barely a day after hitting a new yearly high at $181. The retreat occurred alongside Bitcoin’s rejection at $40,000. The bearish leg extended to $150 after failing to find support at $160. LTC has already resumed the uptrend above $160, but gains to $170 and $180 may not come easy.
Litecoin struggles to nurture the uptrend
At the time of writing, Litecoin is trading at $161 and holding slightly above the ascending parallel channel’s middle boundary. The price must hover above this critical level to sustain the uptrend heading to $170.
However, a daily close under the middle boundary or even $160 will derail the recovery. Simultaneously, the bearish action could call for more sell orders, creating enough overhead pressure for losses back to $150.
The Moving Average Convergence Divergence emphasizes the pessimistic outlook. A bearish divergence from the MACD hints at an intensifying bearish grip.
%20(21)-637456805487911777.png)
LTC/USD 4-hour chart
The IOMAP model provided by IntoTheBlock, a leading on-chain analysis platform, reveals that Litecoin recovery is heading into an immense resistance zone running from $170 and $175. Here, roughly 40,500 addresses previously bought approximately 3.6 million LTC. Note that a break past this zone could also see LTC spike towards $200.
On the downside, medium-strong support has been highlighted between $155 and $160. Here, nearly 35,000 addresses had previously bought almost 2.4 million LTC. If the price stretches under this area, the bearish leg could explore levels under $145.
-637456805907964584.png)
Litecoin IOMAP model
The confluence detector tool shows that robust support exists at $161. The buyer concentration zone has been highlighted by the 100 Simple Moving Average 1-hour and the daily 61.8% Fibonacci level.
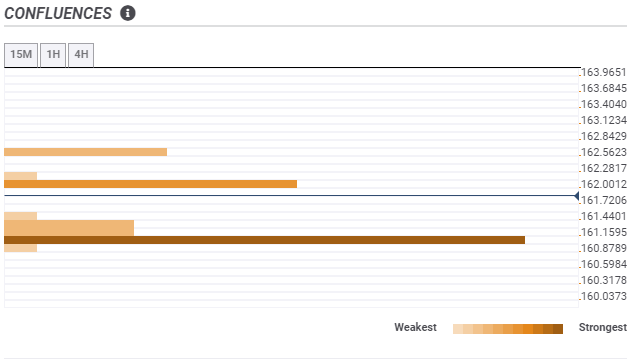
LTC/USD confluence levels
This support must be guarded to avoid potential massive losses. On the upside, some delay is still expected at $162, as shown by the Bollinger Bands 4-hour middle curve. Another critical resistance level to keep in mind is $162.6, home to the 15-minutes previous high and the 1-hour previous high.
Author

John Isige
FXStreet
John Isige is a seasoned cryptocurrency journalist and markets analyst committed to delivering high-quality, actionable insights tailored to traders, investors, and crypto enthusiasts. He enjoys deep dives into emerging Web3 tren


