Litecoin Price Analysis: LTC technicals spell trouble while on-chain metrics forecast upswing towards $370
- Litecoin price faces a potential roadblock since the TD Sequential indicator presented a sell signal on both the 4-hour and the 3-day chart.
- LTC is at crossroads as on-chain metrics hint at an upswing contradicting the near-term bearish signals.

Boasting over 270% returns in the last quarter of 2020, Litecoin is one of the best performing cryptocurrencies. With most altcoins rallying to new highs, LTC bulls might need to take a break as the TD Sequential indicator flashed sell signals across multiple time frames.
Litecoin price may pullback before rising to higher highs
Litecoin price shows signs of weakness after an uninterrupted bull run since early December. The bearish formations presented by the TD sequential indicator could provide LTC with a much-needed retracement.
If sell orders begin to pile up, the fifth-largest digital asset may take a nosedive towards the nearest support barriers at $150 and $120.
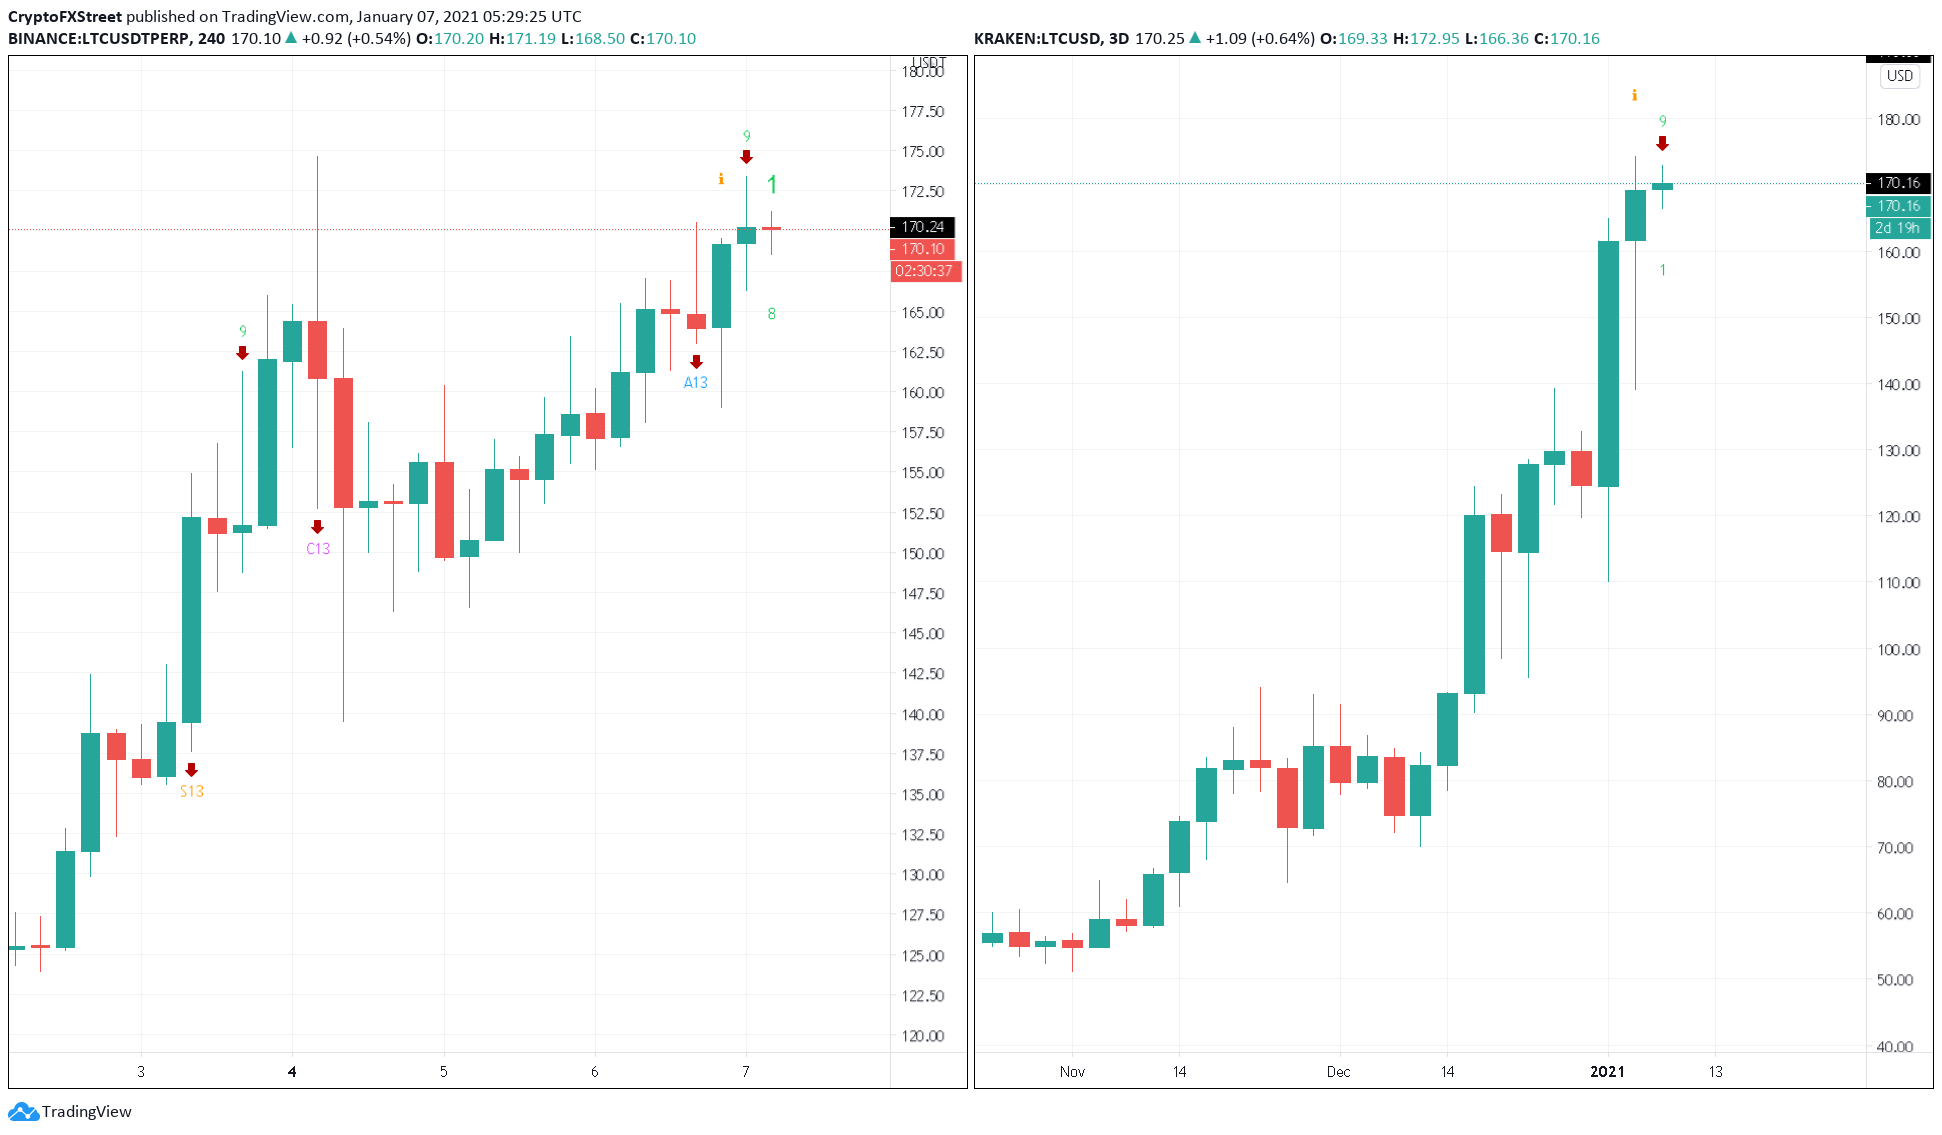
LTC/USD 4-hour and 3-day chart
Adding credence to the TD setup’s pessimistic outlook, a bearish divergence seems to have developed between Litecoin price and the RSI. A similar behavior can be seen against the OBV, which is making a series of lower lows while prices have been surging.
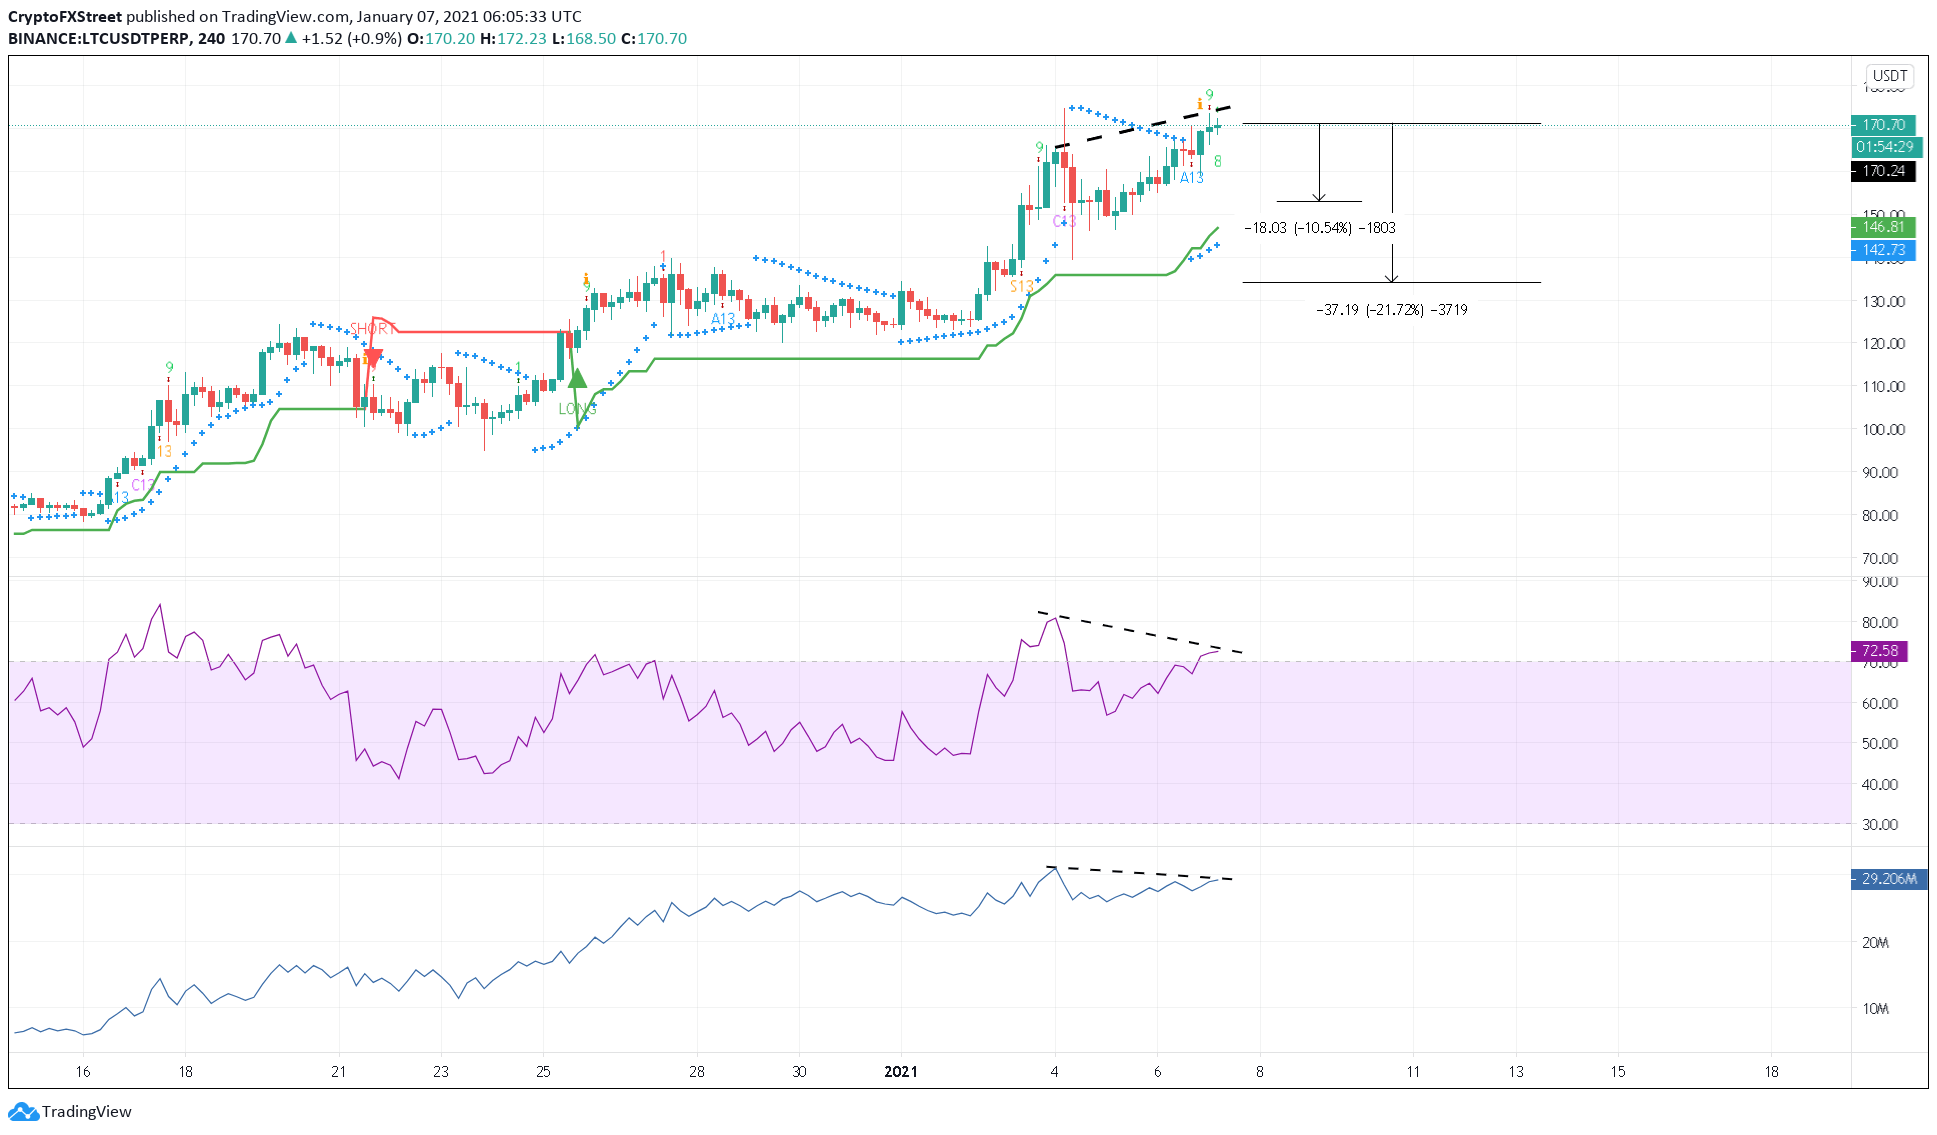
LTC/USD 4-hour chart
If a spike in downward pressure was to validate these bearish signals, there are two fundamental levels to keep an eye out for. The $155 support represents a 10% downswing from LTC’s current market value.
Further selling pressure at this level could cause Litecoin price to slide to $135.
On-chain metrics remain bullish
Despite the multiple sell signals that Litecoin price presents from a technical perspective, its on-chain activity suggests that the bull rally may prolong. The number of new addresses joining LTC’s network rose by more than 57% in the last month.
Usually, when the network expands for a prolonged period, prices tend to follow.
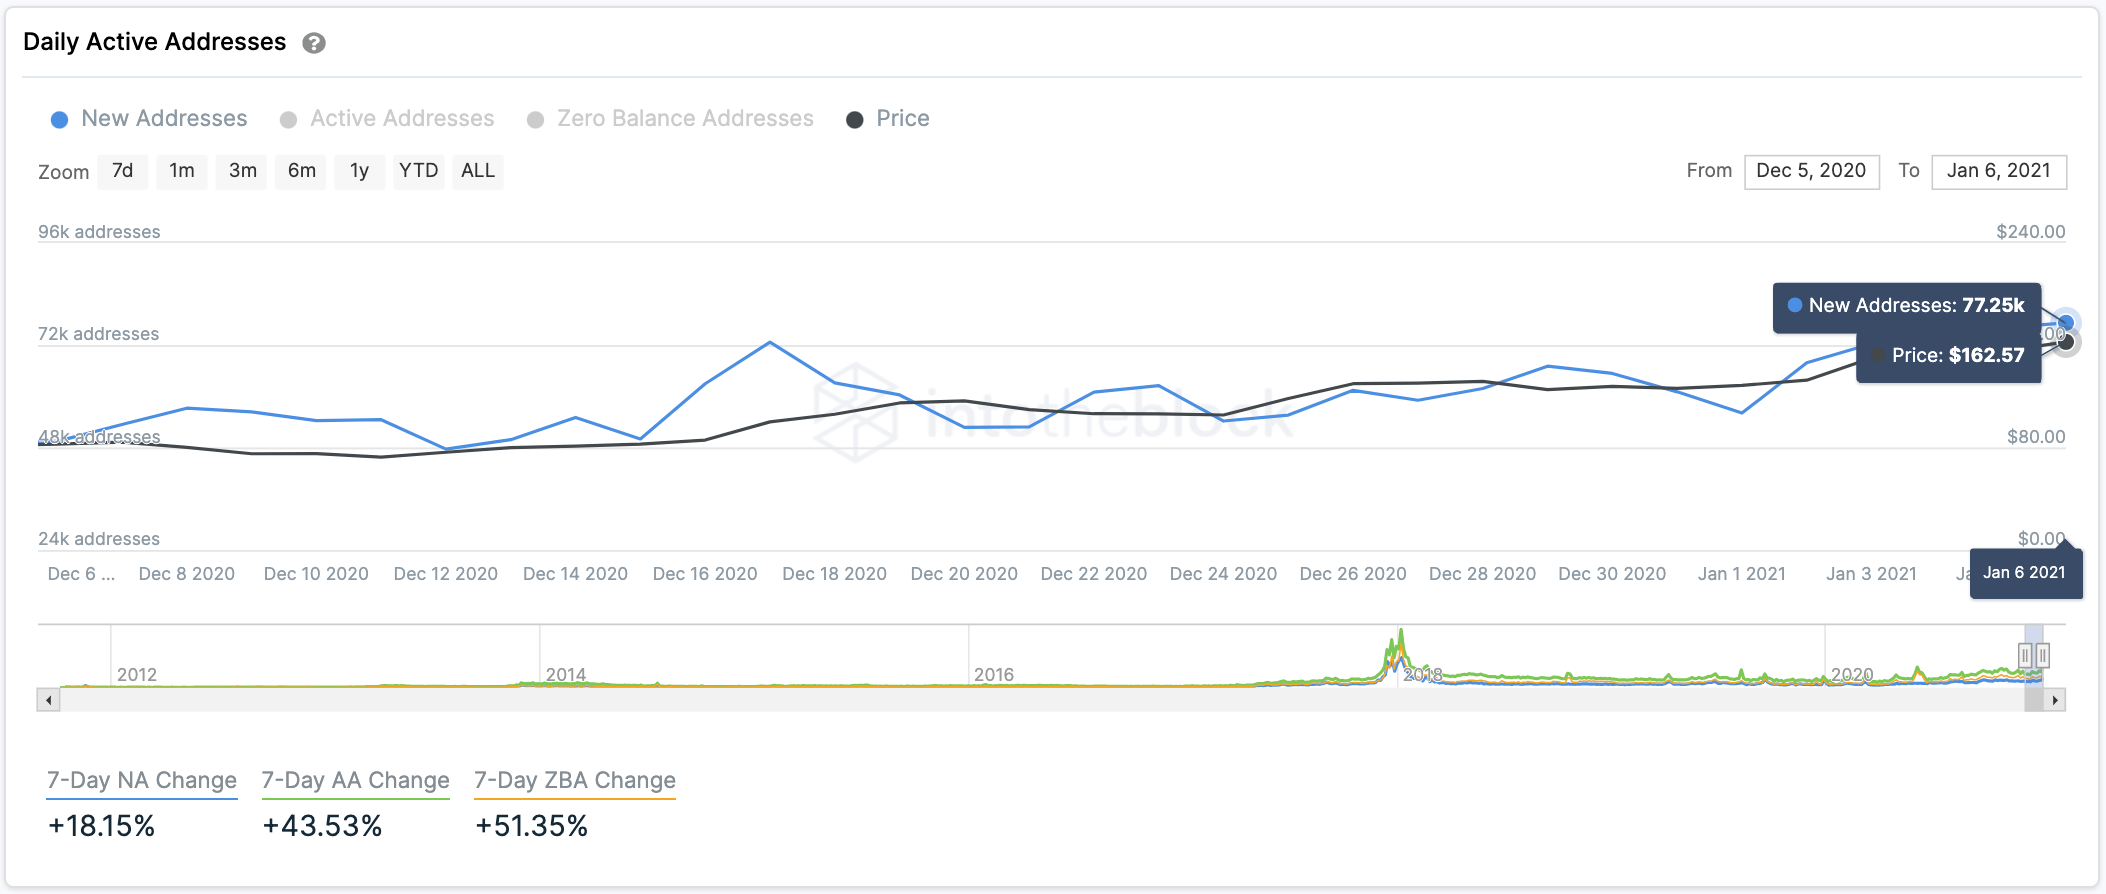
Litecoin’s daily active addresses
Moreover, the In/Out of the Money Around Price (IOMAP) metric from IntoTheBlock shows little to no resistance ahead of Litecoin price. The only significant supply wall that may pose a threat to this altcoin’s uptrend lies around $190.
An upswing beyond the overhead resistance would invalidate the bearish signals and lead to further gains.
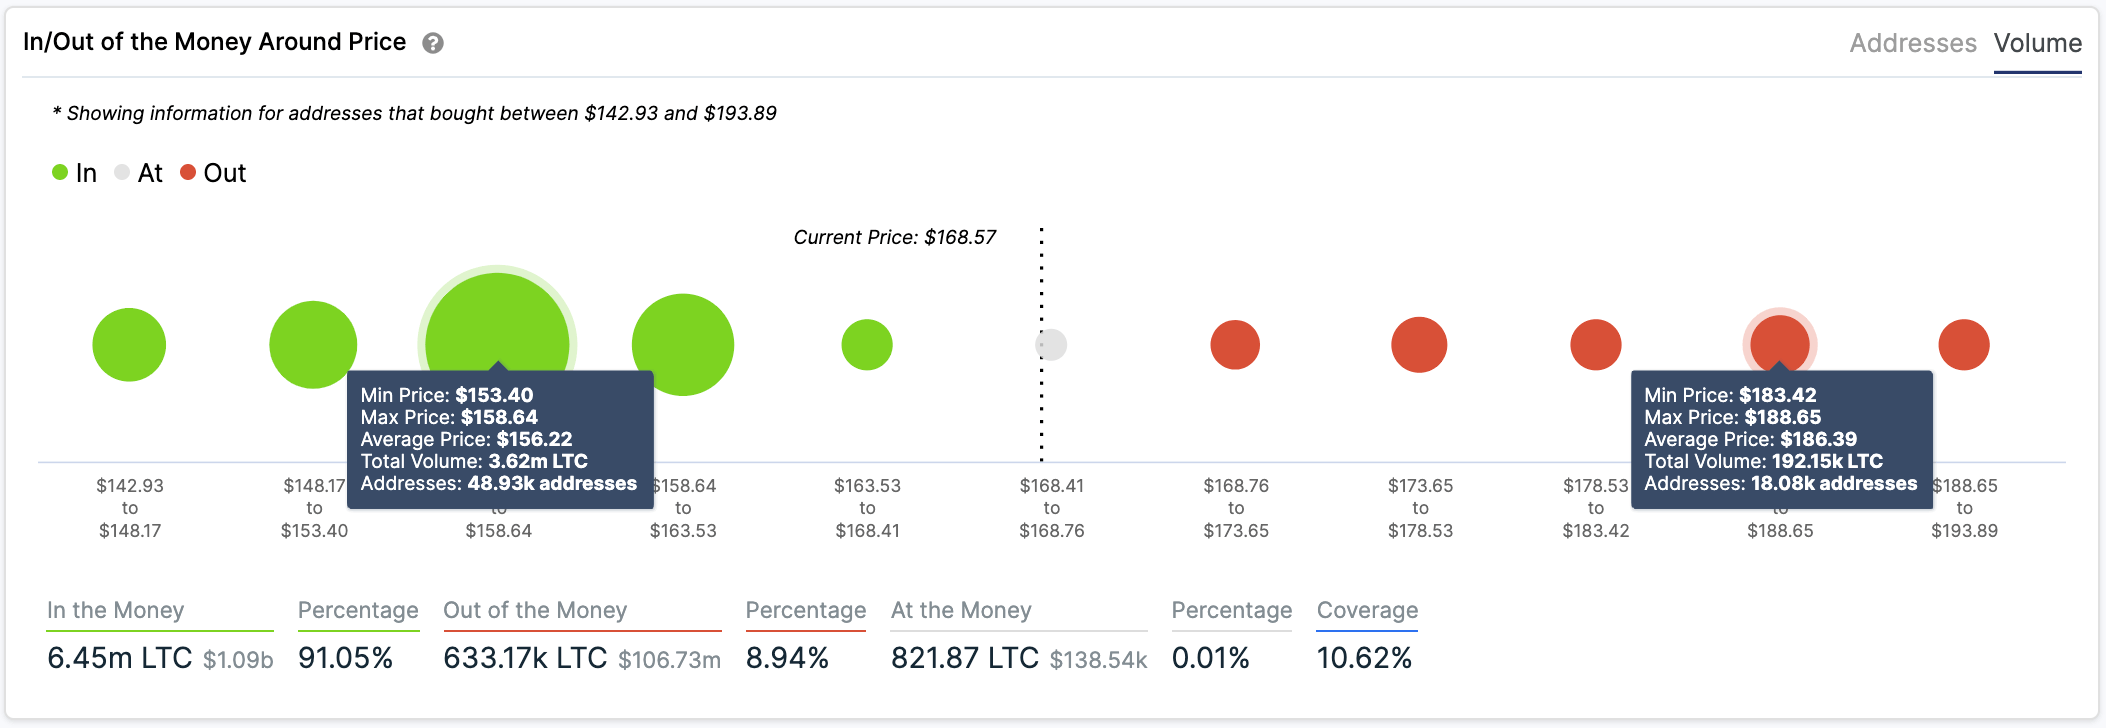
Litecoin IOMAP
Nonetheless, Litecoin seems to sit on top of stable support that may keep falling prices at bay in the event of a sell-off. The demand barrier at $150 will be the first line of defense since 131,000 addresses have previously accumulated 5.48 million LTC around this price level.
Holders within this range will likely try to prevent seeing their investments go into the red. They may even buy more tokens to allow prices to rebound quickly towards new all-time highs.
Author

FXStreet Team
FXStreet
Composed of a group of economic journalists and FX experts, the FXStreet content team produces and oversees all content published on FXStreet. It provides a purely journalistic approach to the Forex market.




