An Introduction To Bollinger Bands
/stock-market-graph-gm532464153-55981218.jpg)
It’s time to take a look at Bollinger bands. And no, unfortunately, it’s nothing to do with champagne.
Bollinger bands are a technical analysis tool invented by John Bollinger. (Who also wrote the imaginatively titled book Bollinger on Bollinger Bands). Basically, they work by measuring the “highness” or “lowness” of a price, compared to previous trades.
They’re made up of a moving average with upper and lower bands based on standard deviations.
FOR EXAMPLE…
A common setting for a Bollinger band is a 20 period moving average with the upper and lower bands set at 2 standard deviations.
Why Use Standard Deviations?
Standard deviations can be used to gives you an idea of how much the price you are looking at varies from the average over a period of time.
In a totally random set of results, you would expect to see 95% of all results falling within 2 standard deviations, and more than 99% to be within 3. So applying this to trading, IF price is completely random, then there’s a very good chance that the next price the market makes will fall somewhere between the upper and lower Bollinger bands.
Of course, this all depends on price being random, and whether this is true or not is an argument for another day. However, even if price is not random, Bollinger bands are still useful to provide an indication of how far price is likely to move in a certain period.
How To Make Bollinger Bands Work For You
Bollinger bands can be applied to both trending and non-trending markets using a slightly different strategy for each environment. Let’s take a look at both, and the best ways to analyse them…
1. Trending Markets
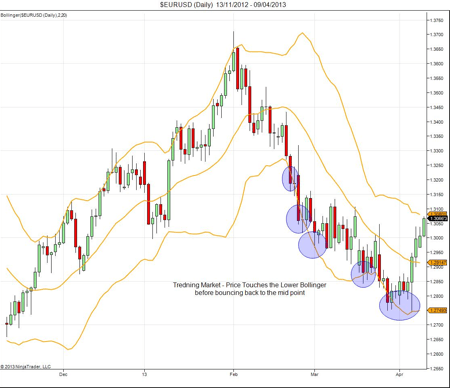
In a trending market, price will be pushing in a particular direction, pushing on either the upper or lower Bollinger band, depending what direction it’s moving in.
This is shown in the chart below:
HOW TO DO IT:
In a trending market, the best way to use Bollinger bands is through the pull back strategy.
Bollinger bands can allow you to use a pull back towards the moving average to enter into the direction of the trend.
WHY IT’S USEFUL:
Using Bollinger bands in this way allows you to run tight stops, in order to capture the trend.
DON’T FORGET:
This works particularly well on lower time frames. When used with good risk/reward management, it can be a really good strategy for use on highly traded pairs (like the EURUSD).
2. Non-Trending Markets
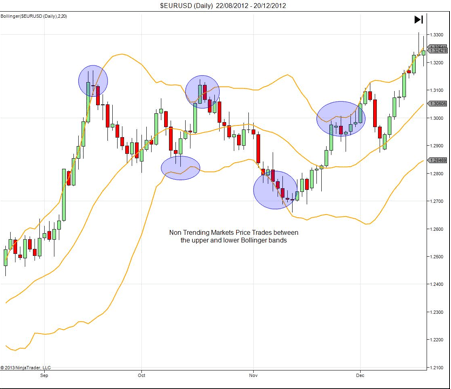
In a non-trending market (also known as range bound or choppy), Bollinger bands can act as barriers to price, as shown in the chart:
HOW TO DO IT:
In a range bound or low volatility environments, you need to use Bollinger bands as a guide to how the price may move. You can do this using the fading strategy.
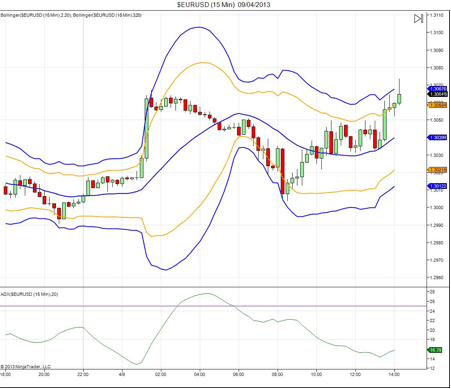
To do this, you need to look for an extreme price movement in low volatility, and then take the opposite position. Then, plot the 20 period moving average, and the 2 and 3 standard deviations on the chart, as shown below:
The final step is to look for the price to hit the outer Bollinger, then move back into the Bollinger range. It if breaks or closes above the inner Bollinger, you can then get in the direction towards the moving average.
Here’s an example of what might happen:
WHY IT’S USEFUL:
This strategy allows you to use relatively tights stops on lower time frames to capture a fade in the opposite direction.
DON’T FORGET:
To make sure you’re in a low volatility environment before using this strategy. (You can do this using ADX or an Awsome Oscilator, or get clues from your moving averages or MACD).
Author

Littlefish FX Analysts
Littlefish FX
Our expert team of analysts, traders and IT developers have developed innovative and cutting-edge Order Flow Systems giving Littlefish FX a bank-level view of the Foreign Exchange Market.