XLM Price Prediction: Stellar soars to $0.47, engaging thrust boosters to hit all-time highs
- Stellar has stepped above the crucial January barrier at $0.41, clearing the path toward record highs at $1.05.
- Various technical levels have aligned in support of the expected upswing.
- XLM must hold above $0.41 to avert potential losses and allow buyers to focus on higher price levels.

Update: Stellar Lumens (XLM/USD) has been surging by double-digits on Thursday and has hit a new all-time high of $0.470000 according to data on Coinbase. The shining digital coin is joined by other cryptocurrencies which are skyrockeintg. Bitcoin (BTC/USD) has topped $48,000 and others are also moving higher. Will they move even higher over the weekend when volatility is low?
Stellar is keen on sustaining the uptrend amid the widespread cryptocurrency rally. The bull run in January hit a barrier at $0.41, culminating in losses as far as $0.225. A recovery ensued, with the bulls eyeing all-time highs at $1.05. Meanwhile, Stellar is teetering at $0.43 after jumping above the critical $0.41.
Stellar swings toward all-time highs after breaking crucial resistance
Stellar’s uptrend must hold above the support at $0.41 to ensure that bulls focus on breaking the resistance at $0.55 and $0.65 and set the pace for the much-anticipated run-up to all-time highs.
Despite the rally in February, XLM is not yet overbought, according to the Relative Strength Index on the 12-hour chart. In other words, the cross-border token has room for growth, perhaps until it rises higher than the first key hurdle at $0.55.
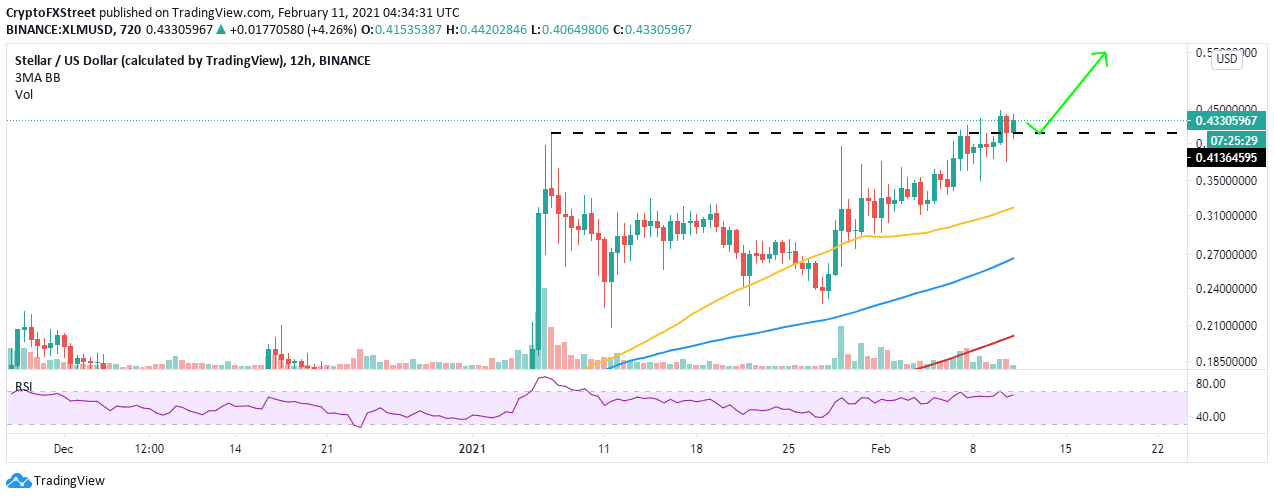
XLM/USD 12-hour chart
The parabolic SAR points are below the price on the 4-hour chart, reinforcing the bullish outlook. As long as Stellar remains above these key trend indicator points, the uptrend toward $1.05 will be unrelenting.
Similarly, the Moving Average Convergence Divergence (MACD) adds credibility to the uptrend as it lifts higher above the midline. Besides, the MACD line (blue) has crossed above the signal line, adding more weight to the bullish outlook.
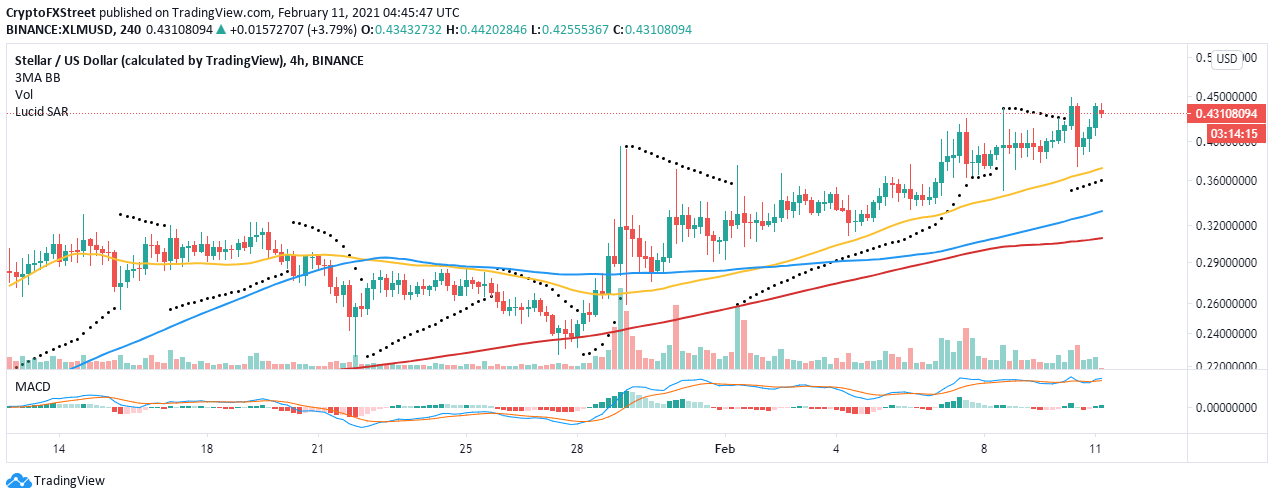
XLM/USD 4-hour chart
Looking at the other side of the fence
It is worth keeping in mind that the failure to hold above $0.41 would sabotage the expected rally toward all-time highs. In the event losses proceed beneath this level, Stellar will be seeking support at the 50 Simple Moving Average (SMA) around $0.37 on the 4-hour chart. Other vital price levels to keep in mind include the 100 SMA currently at $0.34 and the 200 SMA holding slightly above $0.30.
Author

John Isige
FXStreet
John Isige is a seasoned cryptocurrency journalist and markets analyst committed to delivering high-quality, actionable insights tailored to traders, investors, and crypto enthusiasts. He enjoys deep dives into emerging Web3 tren


