XLM Price Prediction: Stellar breakdown to $0.3 brews amid consolidation
- Stellar is dealing with intensifying selling pressure after the rejection at $0.435.
- Declines to $0.3 will come into the picture if Stellar closes the day under $0.4.
- The uptrend toward an all-time high will continue if the parabolic SAR points flip bullish.

Stellar has slowed down the persistent uptrend aiming for the all-time highs of around $1. The recovery towards the end of January and the first week of December has been incredible. However, a yearly high formed at $0.435, limiting additional movement. Consolidation seems to be taking over amid signals for a correction to lower price levels.
Stellar struggles to shake off the bearish pressure
The failure to continue with the uptrend past the recent high has seen overhead pressure begin to increase. XLM is trading at $0.398 amid the scuffle to restore the trading above $0.4. Glancing upwards, we can see the cross-border token trading below the parabolic SAR points. Trading below the parabolic line (dots) suggests that the trend is turning bearish and is probable not to buy.
Consequently, the Relative Strength Index reveals that the ongoing sideways trading may last longer. The technical indicator is leveling at 62, which is not entirely bearish, but at the same time, it is not a bullish signal. A motion toward the midline will reveal an increase in selling pressure.
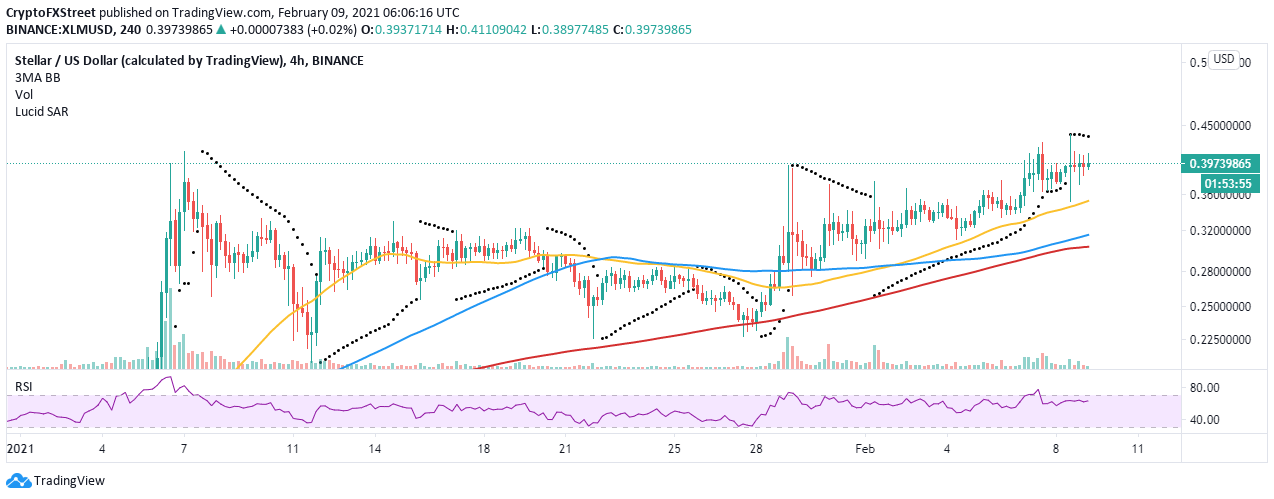
XLM/USD 4-hour chart
In case of a breakdown from the current price level, Stellar will seek initial support at the 50 Simple Moving Average on the 4-hour chart close to $0.35. If selling orders surge and the overhead pressure surges, we can expect XLM to explore downhill levels toward $0.3. Note that the 100 SMA will anchor the price, perhaps absorb the selling pressure before hitting $0.3.
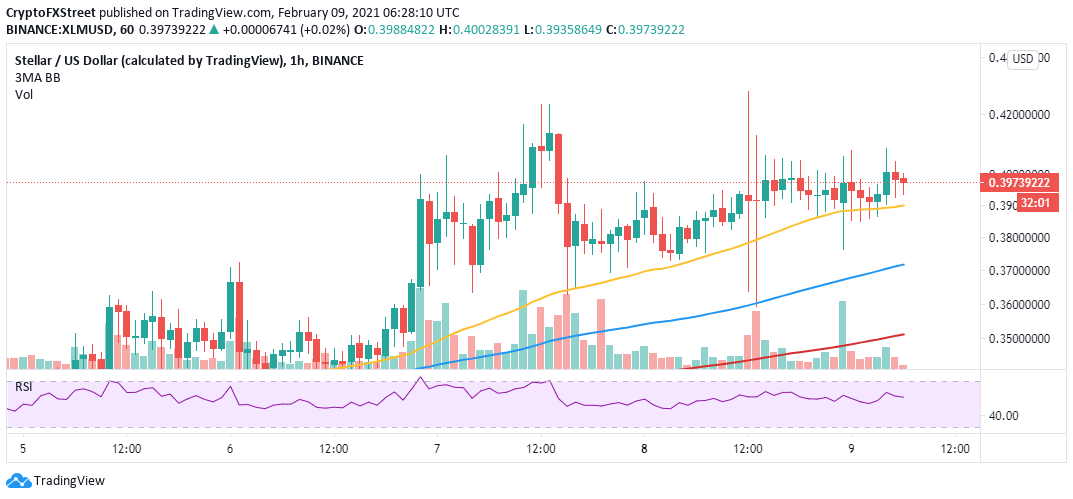
Short-term analysis on the hourly chart validates the bearish narrative, especially with the RSI diving fast towards the midline. The near term support at the 50 SMA must also be guarded at all costs to ensure that selling orders are not triggered. Trading under the midline is likely to increase the overhead pressure, pushing XLM towards $0.35.
XLM/USD 4-hour chart
Looking at the other side of the fence'
It is worth mentioning that the pessimistic outlook will be nullified if Stellar closes the day above $0.4. Gains above this level would encourage more buyers to join the market, allowing Stellar to continue with the mission towards $1. Moreover, if the parabolic SAR points flip bullish, Stellar’s uptrend will continue.
Author

John Isige
FXStreet
John Isige is a seasoned cryptocurrency journalist and markets analyst committed to delivering high-quality, actionable insights tailored to traders, investors, and crypto enthusiasts. He enjoys deep dives into emerging Web3 tren


