Stellar Price Forecast: XLM breakout was cut off short as bears take control
- On the 12-hour chart, Stellar price attempted to break out of an ascending triangle pattern.
- The fakeout could lead XLM towards a low of $0.33.
- The digital asset needs to defend the crucial support level at $0.40 to invalidate the potential of a fakeout.

Stellar price just reached a new 2021-high at $0.446 but got rejected significantly dropping towards $0.372 within the next 12 hours. It seems that bears have taken control over the short-term and can push XLM further down.
Stellar price rejection can lead to a bearish sell-off
On the 12-hour chart, Stellar had a breakout from an ascending triangle pattern that seems to have turned into a fakeout as the price got rejected quickly pushing the digital asset below the previous resistance level.
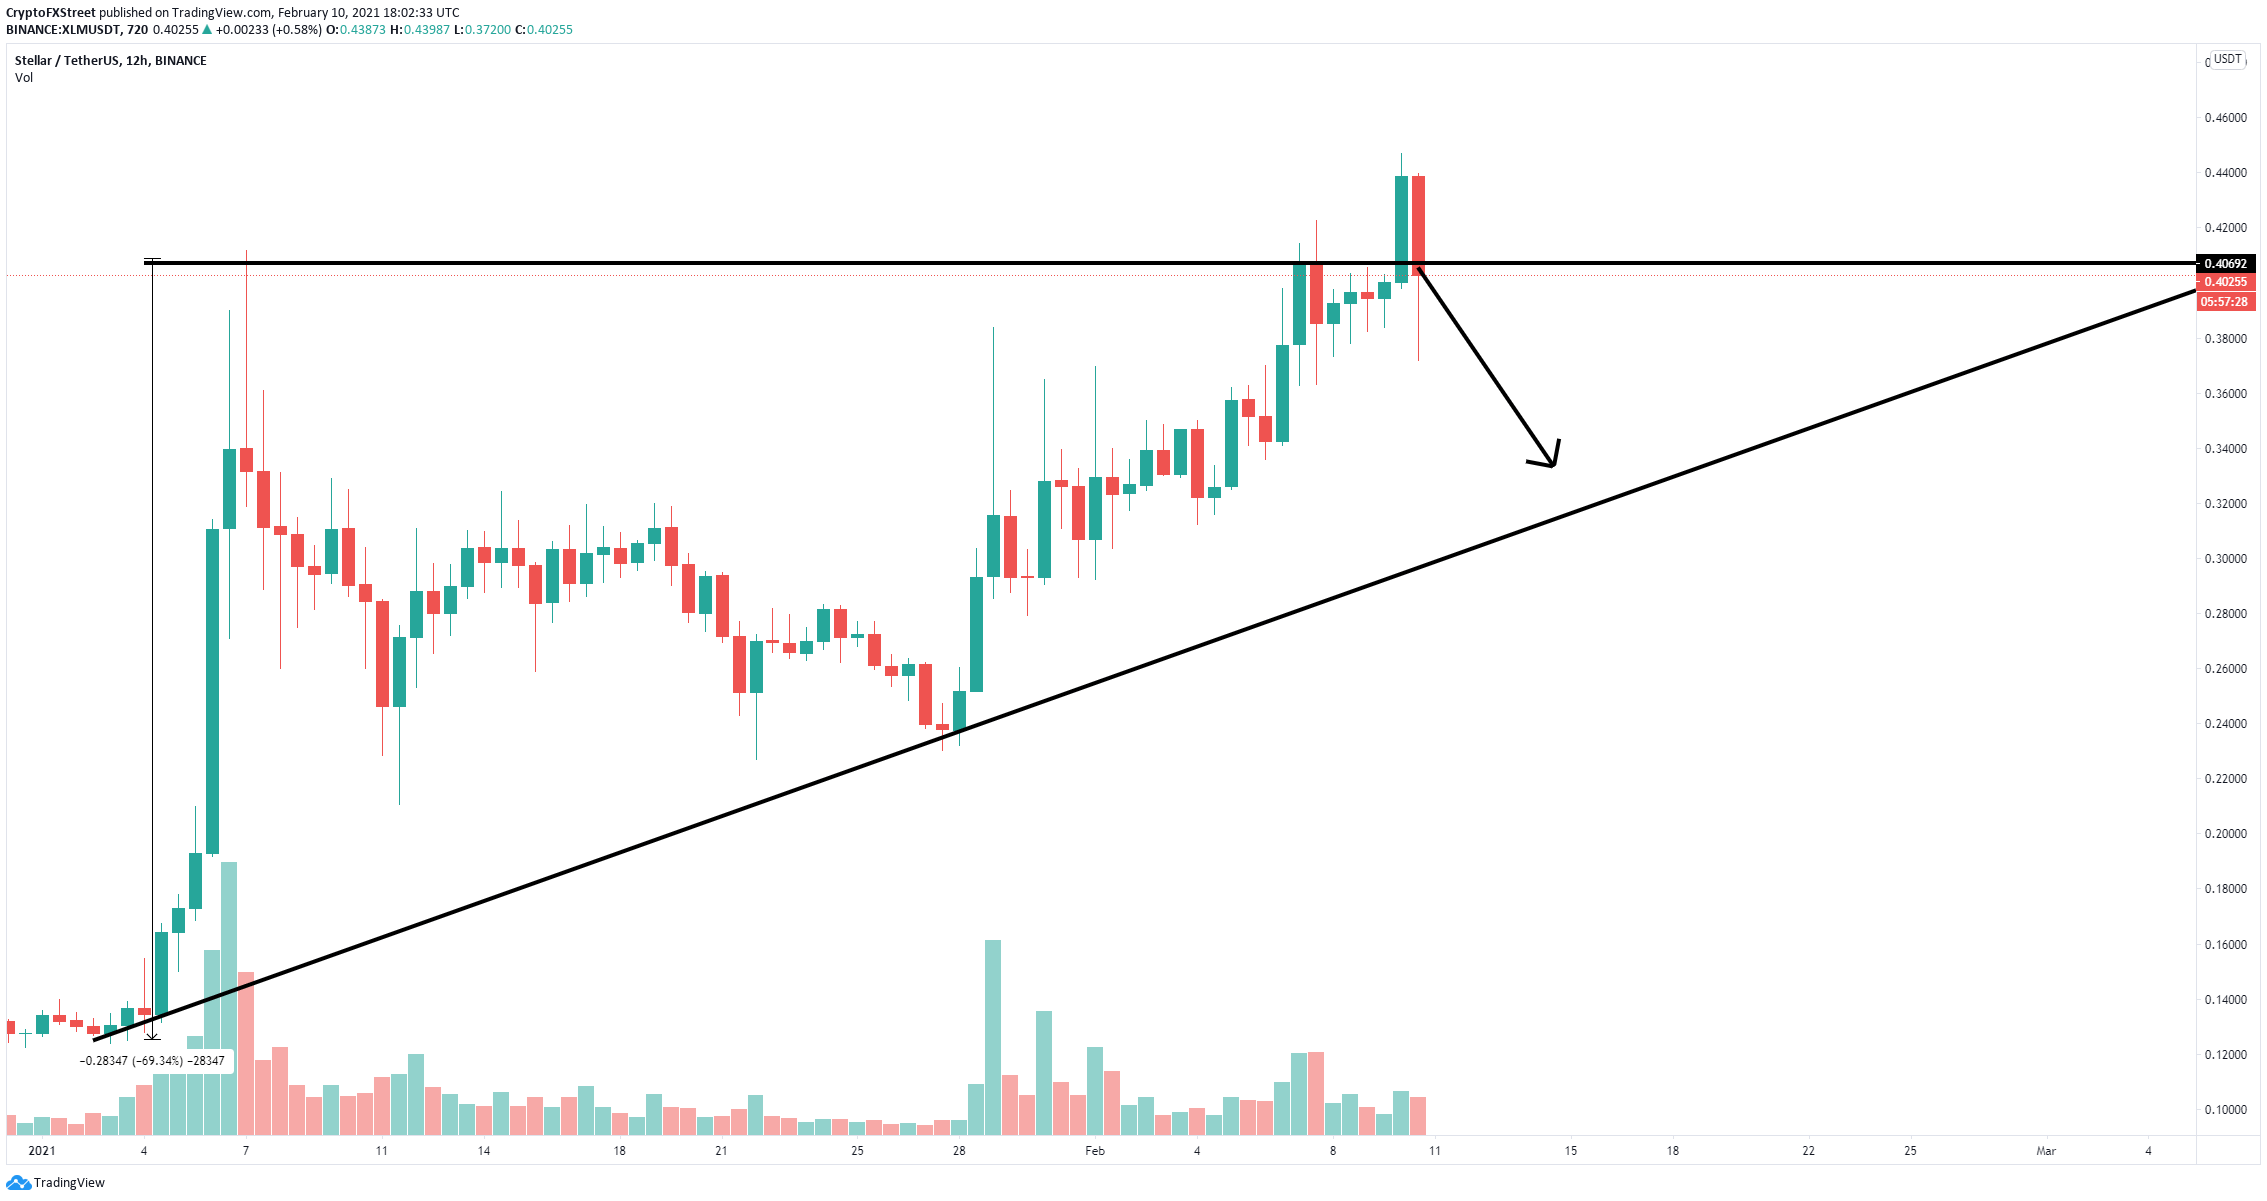
XLM/USD 12-hour chart
If the previous resistance level, now turned into support at $0.40 can’t be defended, Stellar price can quickly fall towards the lower trendline at $0.33. Additionally, on the 9-hour chart, the TD Sequential indicator has presented a green ‘8’ candlestick which is usually followed by a sell signal, adding more credence to the bearish outlook.
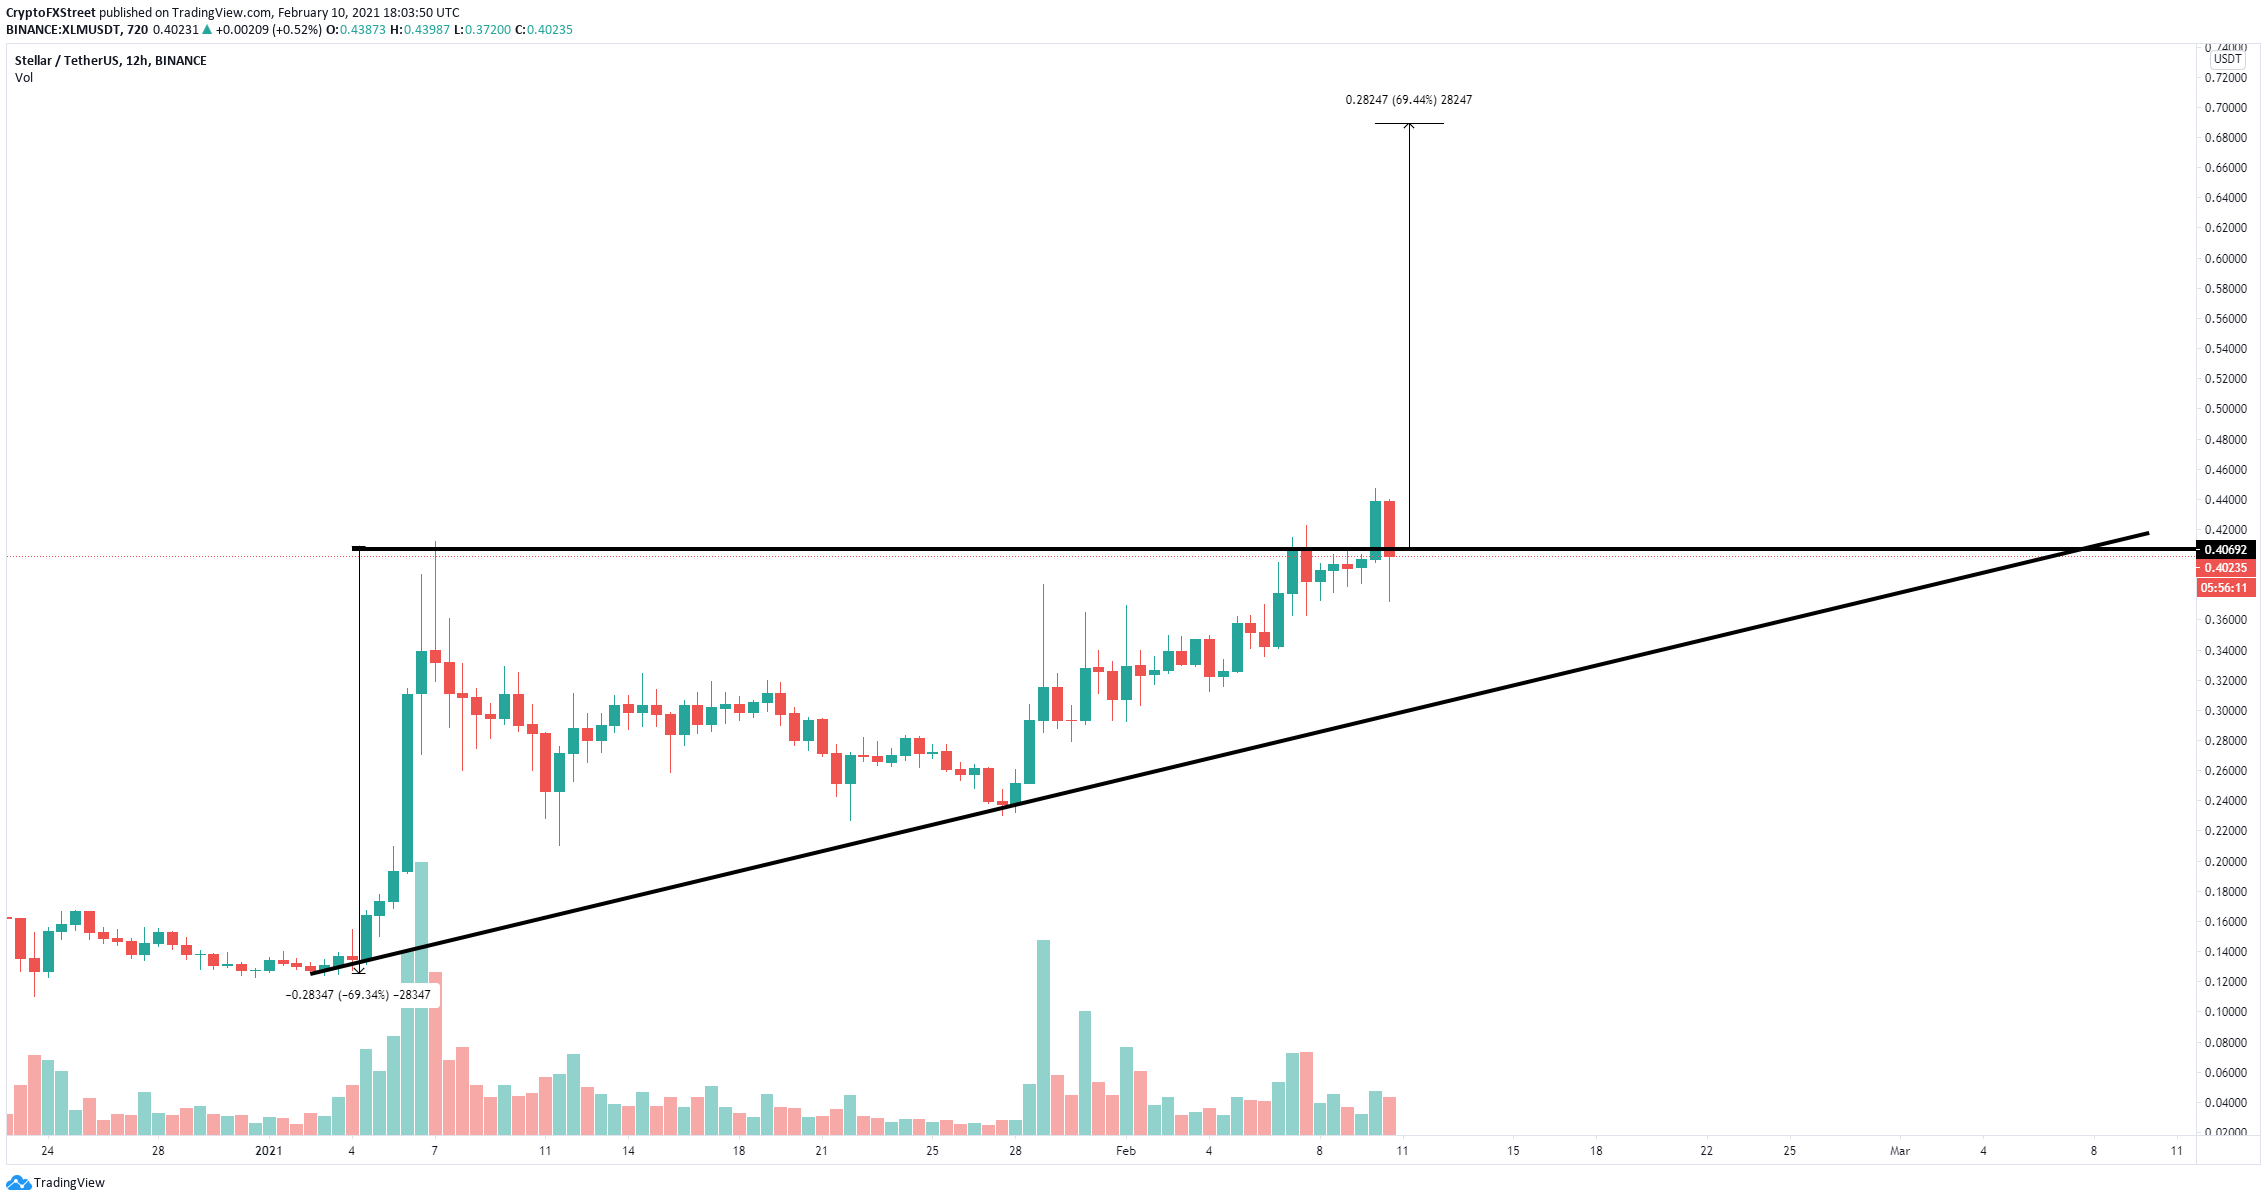
XLM/USD 12-hour chart
However, if bulls can defend the support level at $0.40, the breakout would continue. The price target of the ascending triangle pattern is $0.70 which can be reached in the long-term as long as the bulls can see a significant rebound from $0.40.
Author

Lorenzo Stroe
Independent Analyst
Lorenzo is an experienced Technical Analyst and Content Writer who has been working in the cryptocurrency industry since 2012. He also has a passion for trading.


