VeChain Price Analysis: VET prints massive bullish outlook eyeing colossal 60% move
- VeChain is nurturing a potential breakout to $0.082 following a bounce from crucial support.
- The bull flag is a bullish continuation pattern, implying that recovery is around the corner.
- VET may fail to break out if the MACD line stays under the signal line on the 4-hour chart.

VeChain is getting ready for another leg up after spending the last week searching for higher support. The need to secure a robust buyer congestion zone emerged after VET was rejected from the recently formed record high of $0.061. At the time of writing, the altcoin is exchanging hands at $0.05 amid the buyers' persistent push for gains toward $0.061.
VeChain is on the brink of another breakout
The 4-hour chart shines a light on the formation of a bull flag pattern. The pattern manifests in a pole (representing an upswing in price) and a flag, showing consolidation. As the flag forms, the asset refuses to drop extensively, allowing bulls to seize the opportunity and effect a reversal. The breakout that ensues from a bull flag results in a massive move higher, equal to the pole's length.
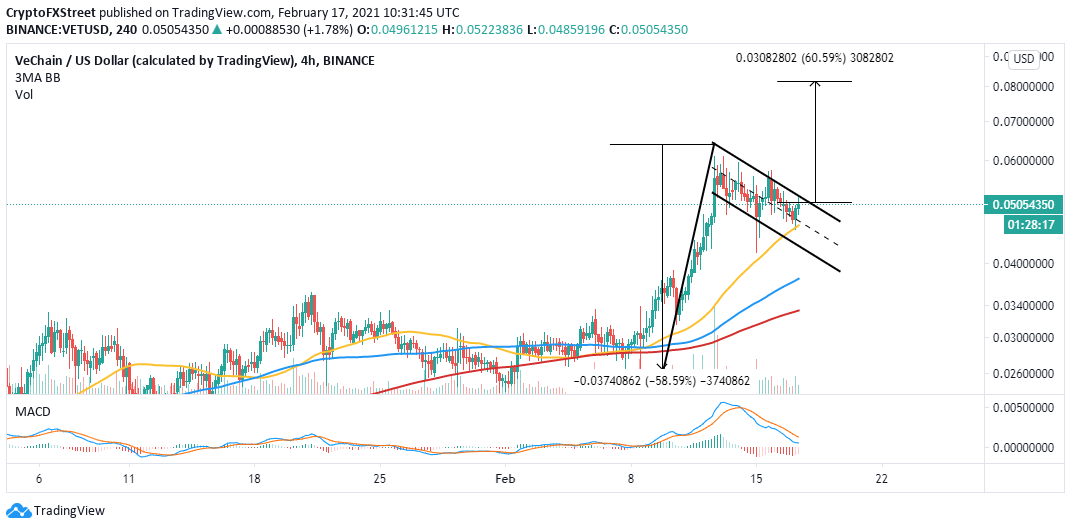
VET/USD 4-hour chart
In line with that, VeChain is likely to jump 60% to $0.082 following the impending breakout. Support at the midline of the channel is critical to the uptrend. Moreover, VeChain is trading above all the applied moving averages on the 4-hour chart, including the 50 Simple Moving Average (SMA), the 100 SMA, and the 200 SMA, which shows that the VET has a bullish impulse.
Looking at the other side of the fence
The same 4-hour chart reveals that the Moving Average Convergence Divergence (MACD) is slopping downwards. Besides, the MACD line (blue) is holding under the signal line, implying that the downtrend is still intact. Similarly, failure to confirm the bull flag breakout may call out for more selling orders, mostly because of investor disappointment.
Author

John Isige
FXStreet
John Isige is a seasoned cryptocurrency journalist and markets analyst committed to delivering high-quality, actionable insights tailored to traders, investors, and crypto enthusiasts. He enjoys deep dives into emerging Web3 tren


