VeChain Price Prediction: VET hints at a 250% bull rally if this critical level cracks
- VeChain price is consolidating a multi-year ascending parallel channel, awaiting a breakout.
- A close above the channel’s upper trendline at $0.085 projects at a 250% bull rally towards $0.030.
- However, a failure to close above this critical supply barrier projects a 55% downswing towards the channel’s lower trendline.

VeChain price shows a 365% surge since testing the ascending parallel channel lower trendline on December 23, 2020. At the time of writing, VET has broken out of the channel’s middle line, hinting at a retest of the upper trendline soon.
VeChain price primed to retest a critical level at $0.085
VeChain price broke out from a month-long consolidation near the channel’s middle line on February 9. This breakout resulted in a nearly 100% upswing to $0.050, where VET is currently trading.
VET price fell prey to the overall market crash and has dropped nearly 5%, which is relatively better than other altcoins. Indeed, a spike in buying pressure here suggests that the altcoin could retest the channel’s upper trendline around the $0.085 price level.
However, only a 3-day candlestick close above the said level seals VeChain’s bullish outlook and projects a 250% bull rally towards $0.300.
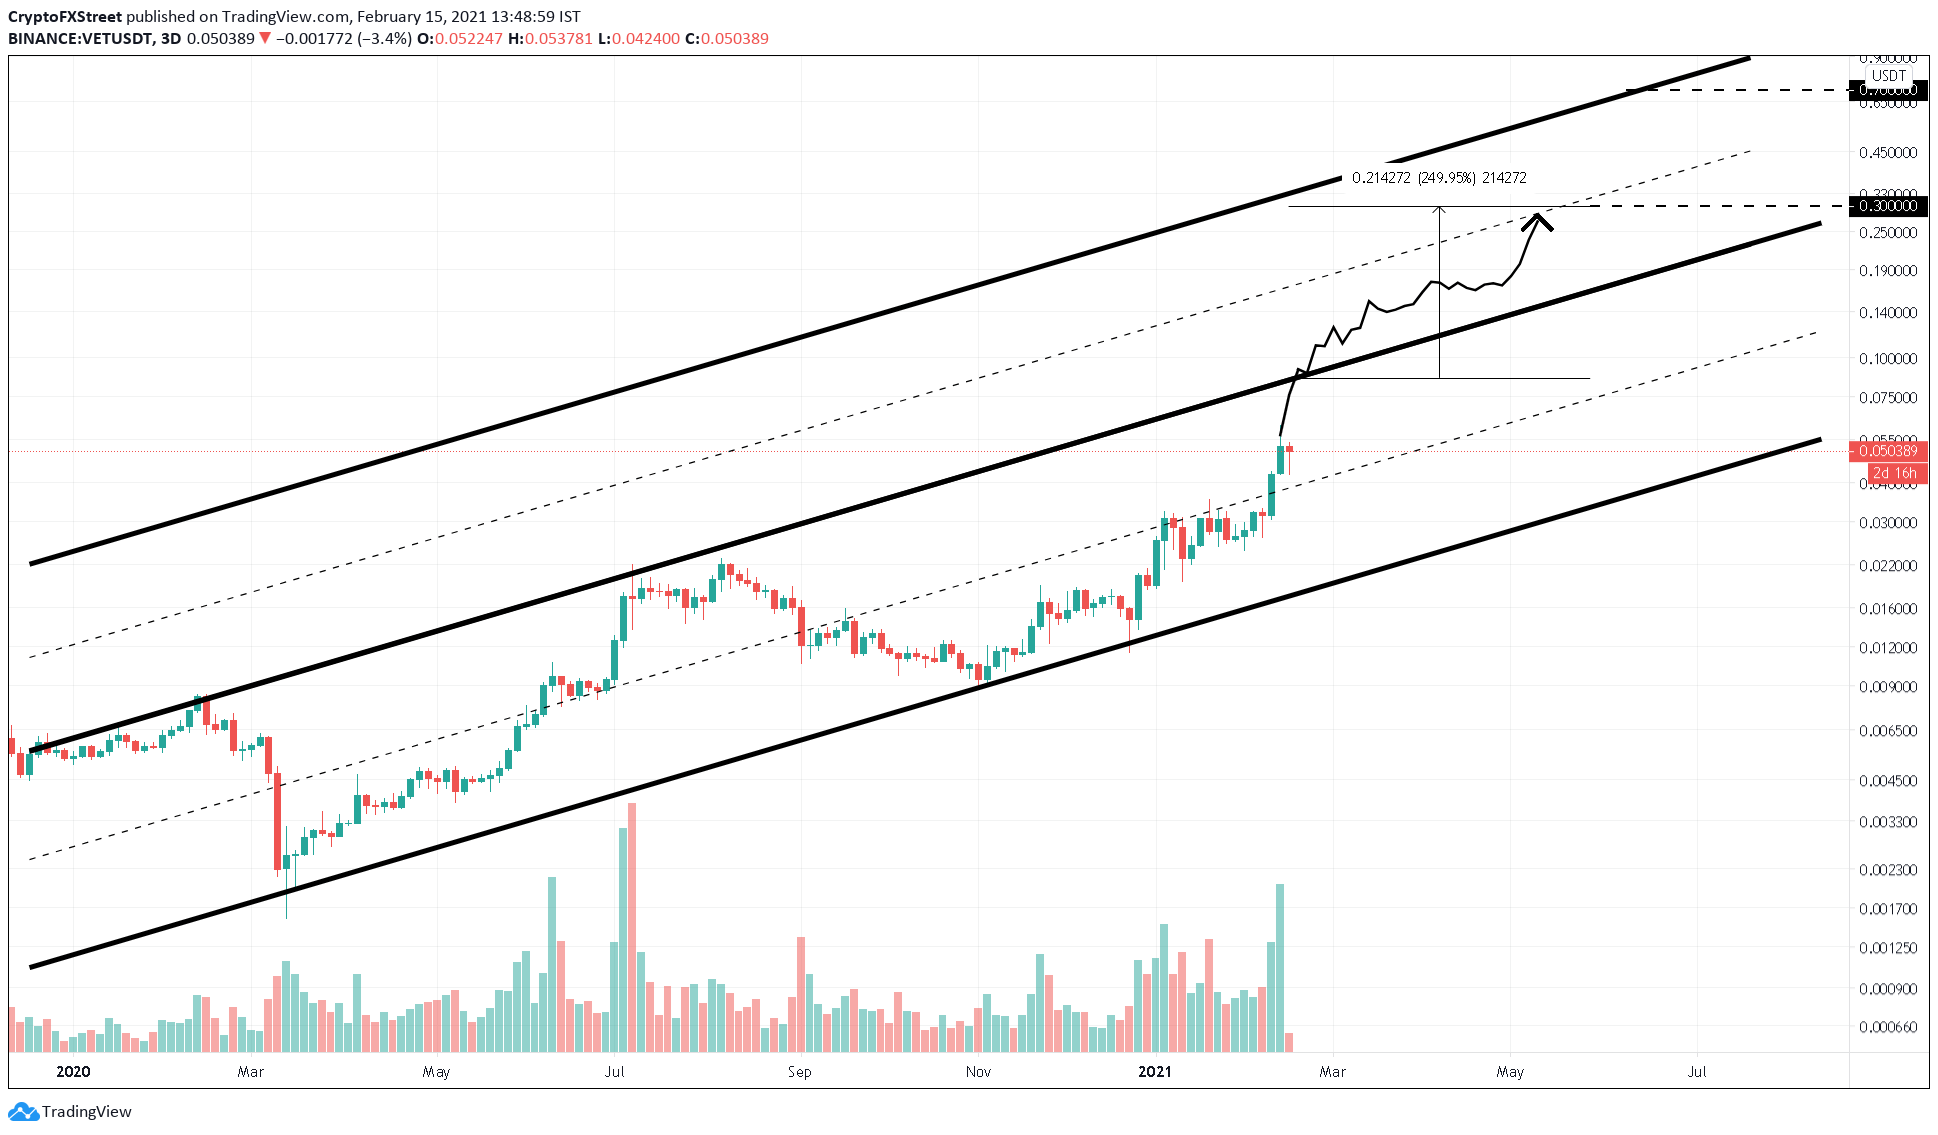
VET/USDT 3-day chart
Adding credence to this bullish outlook is the lack of VeChain’s social volume. Typically, a spike in social volume suggests FOMO among users, which only happens after the price has already surged massively. Hence, a spike in social volume can be used to predict rally tops or reversals.
Therefore, VET’s lack of social volume suggests a bullish outlook from a counter sentiment perspective.
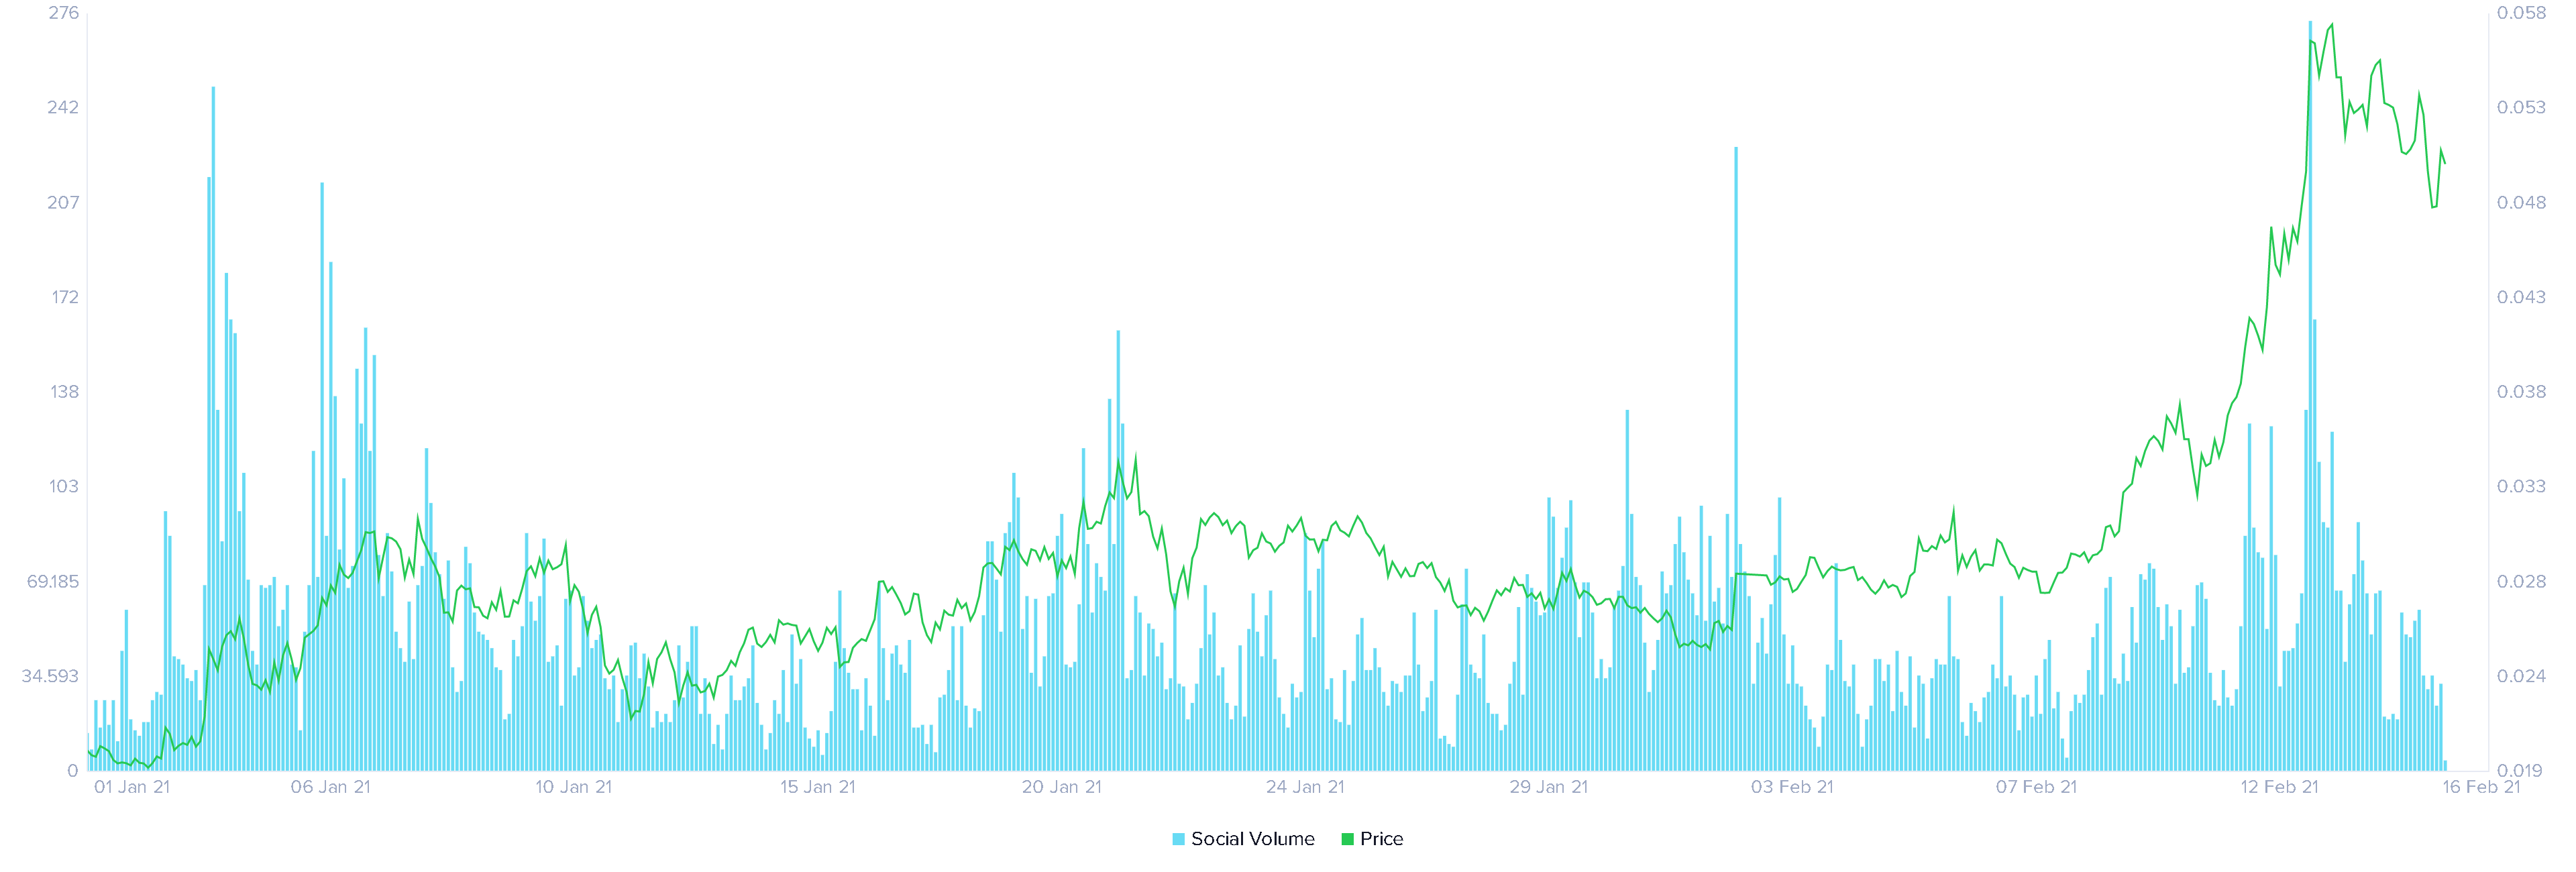
VeChain Social Volume chart
However, a rejection at the channel’s upper trendline could prove fatal to VET. In such a case, VeChain price might continue its descent towards the immediate support, which is the middle line of the ascending parallel channel at $0.037.
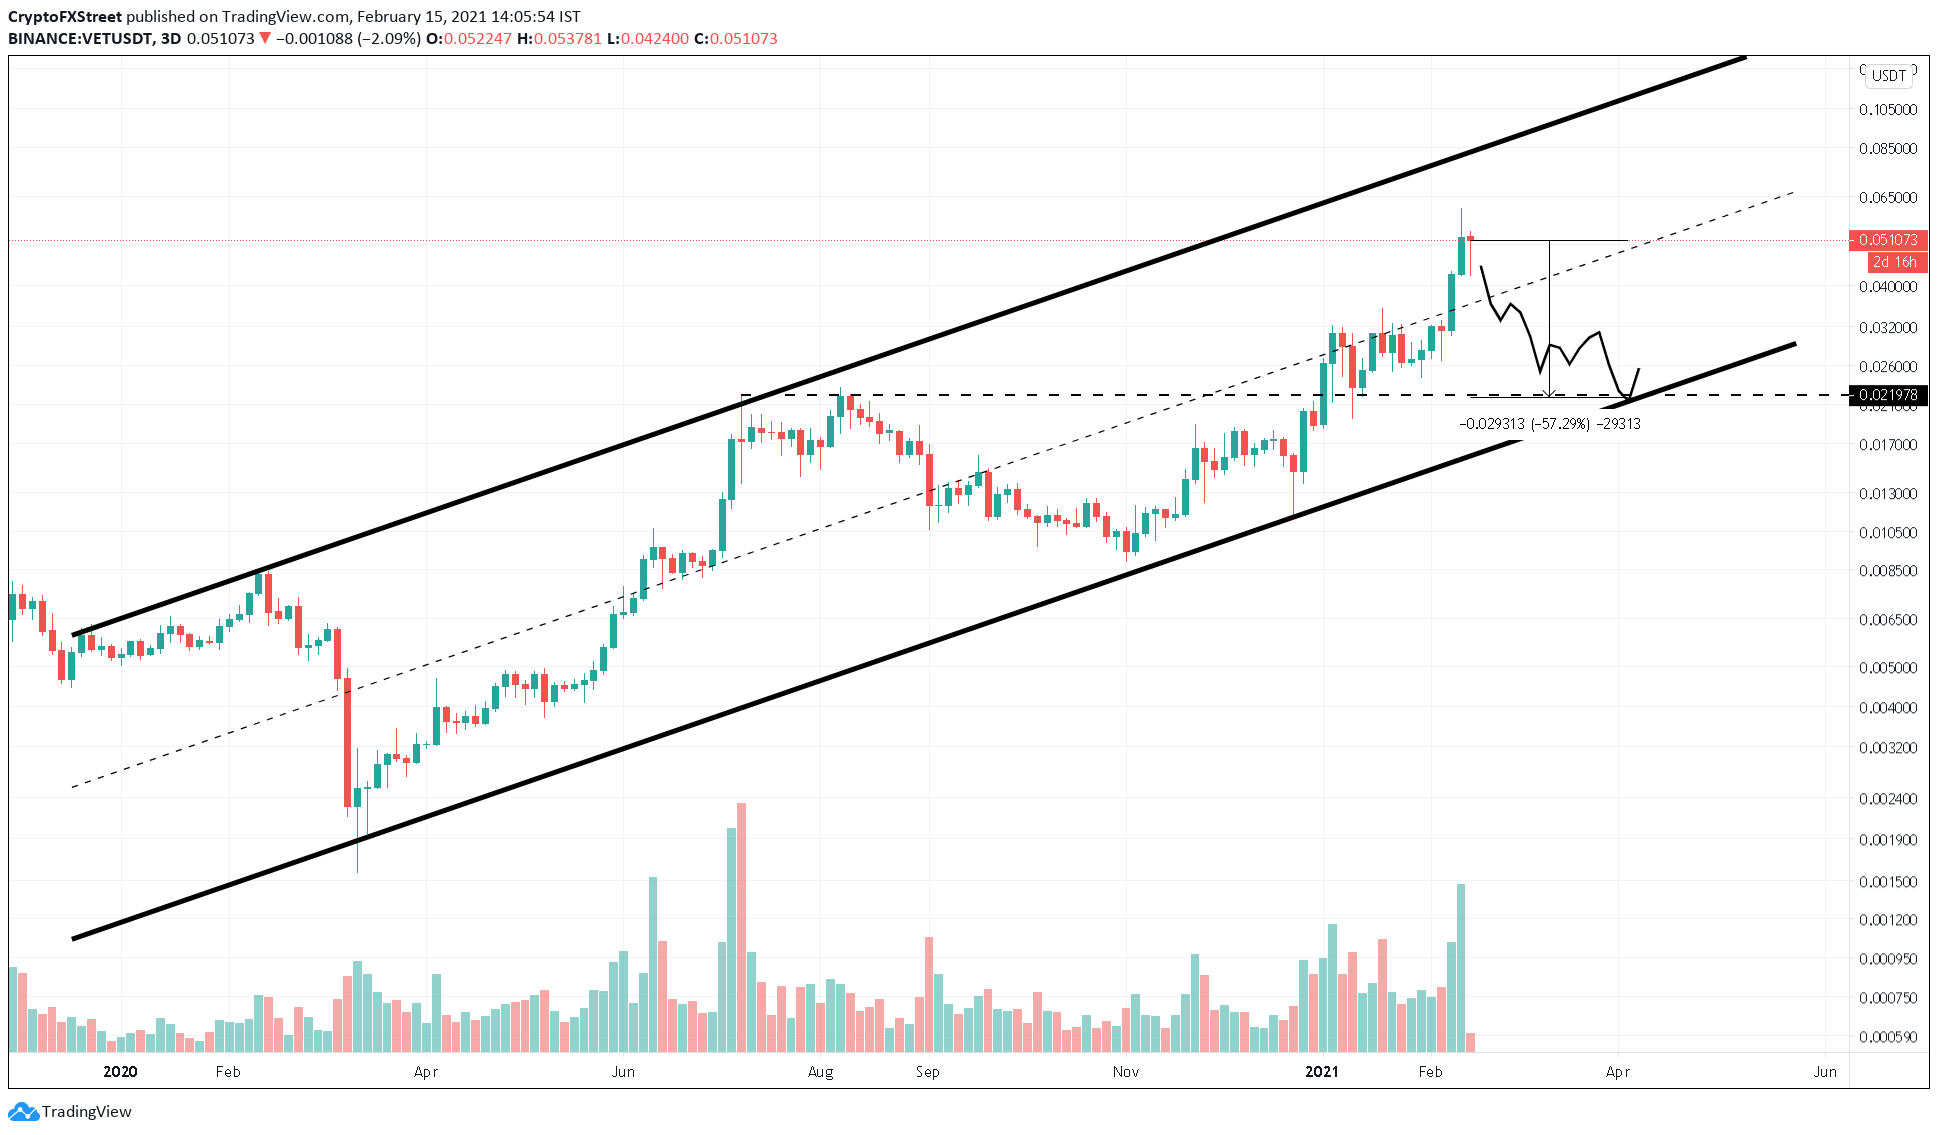
VET/USDT 3-day chart
Supporting this bearish scenario is Santiment's developer activity index. A spike in this metric may be interpreted as a bullish sign by investors who assume it as a precursor to new updates or developmental rollouts.
However, VeChain’s developer activity index crashed by 94% to 0.12 starting from February 9. Considering that the VET price surged 61% between this period, investors may assume that the drop in developer activity may not be priced in yet.
Hence, it is likely that token holders might sell their tokens, pushing VET lower.
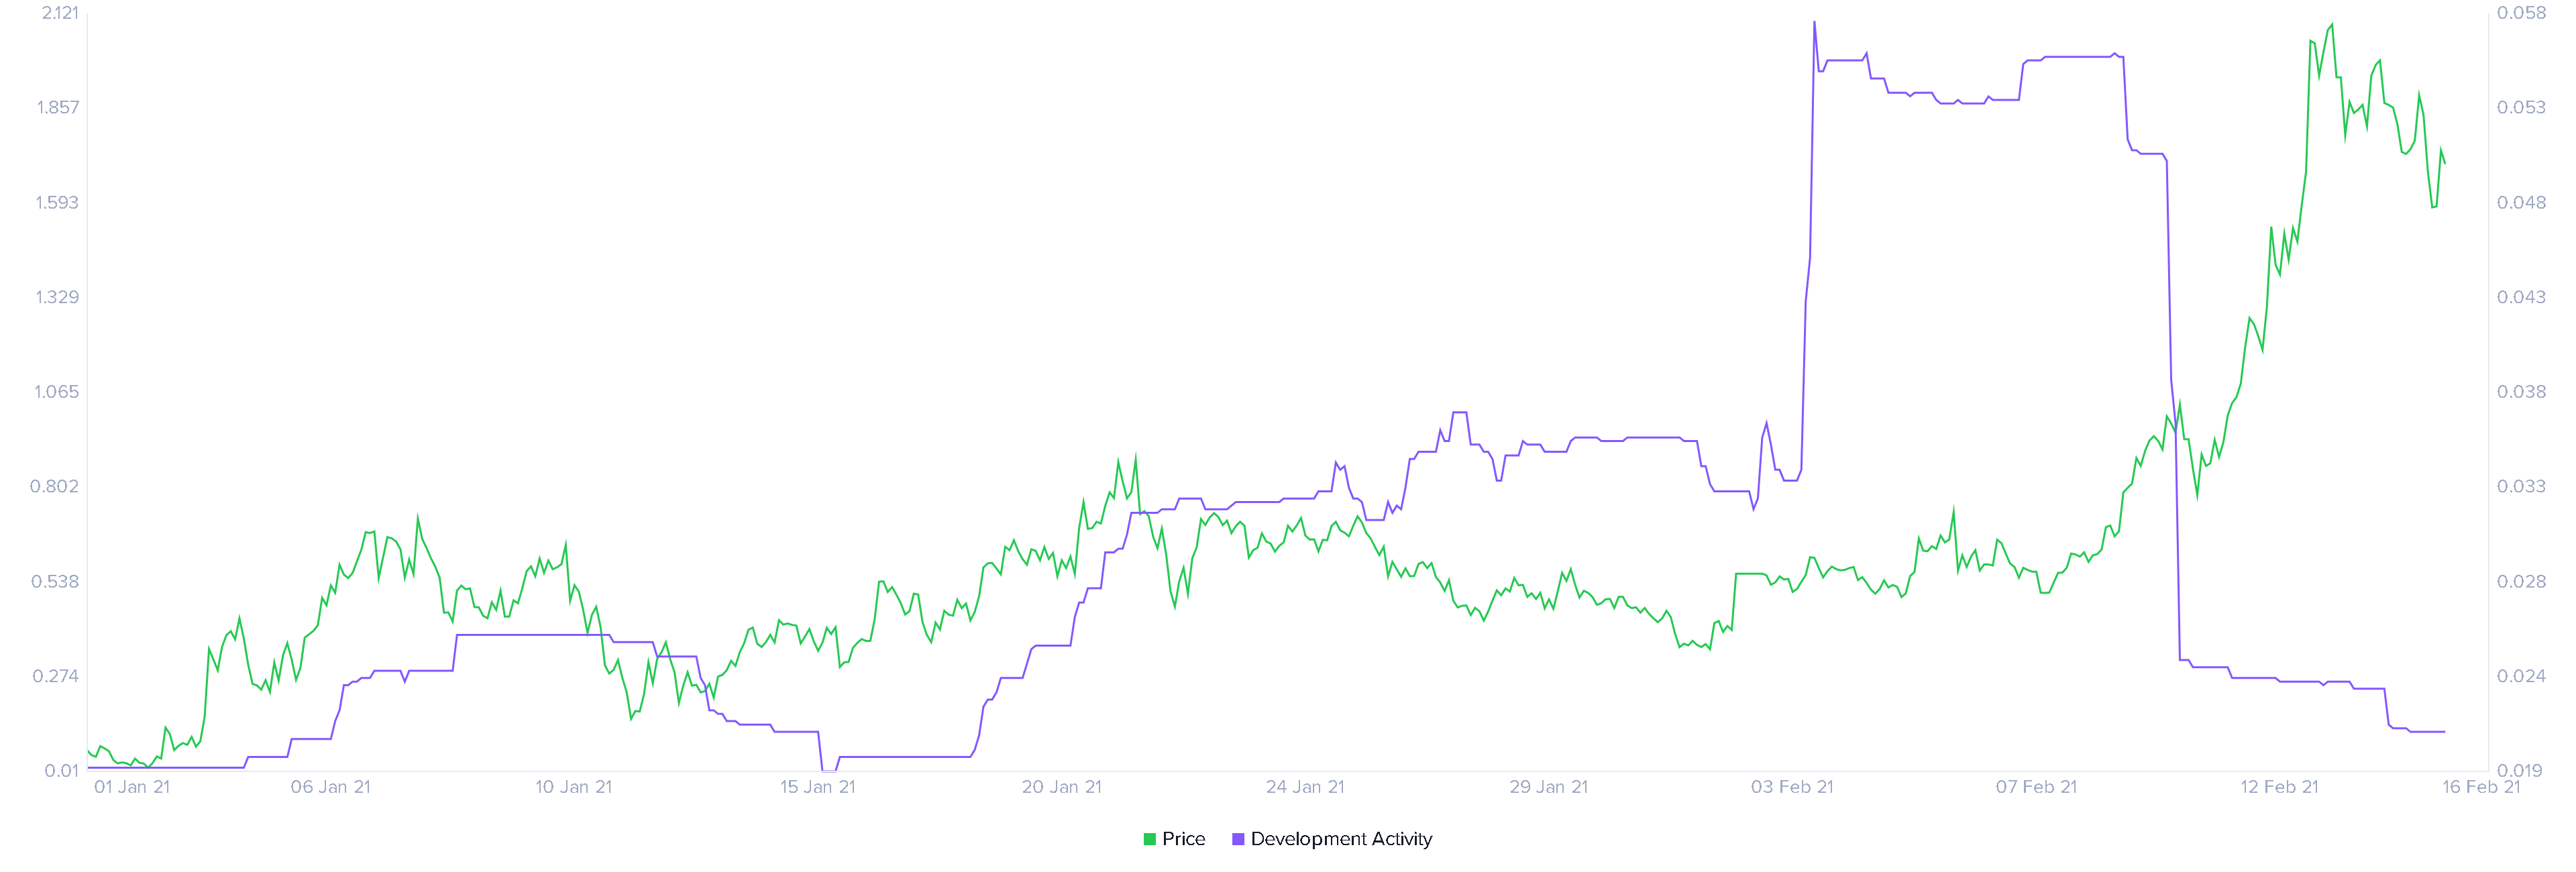
VeChain Developer Activity chart
Therefore, a rejection of the immediate support at the channel’s middle-line could lead to a steep correction to $0.022.
Author

Akash Girimath
FXStreet
Akash Girimath is a Mechanical Engineer interested in the chaos of the financial markets. Trying to make sense of this convoluted yet fascinating space, he switched his engineering job to become a crypto reporter and analyst.


