Vechain price is heading to new all-time highs as resistance weakens
- Vechain price is contained inside a descending triangle pattern on the 4-hour chart.
- The triangle is part of a bull flag that gives Vechain a price target of $0.085.
- VET bulls need to defend a significant support level to aim for a breakout.

Vechain set a new all-time high at $0.06 on February 12 and has been under consolidation since then. VET has formed a potential bull flag and aims for a massive breakout to new all-time highs.
Vechain price needs to hold a key level to see a massive breakout
On the 4-hour chart, Vechain has formed a bull flag and has been consolidating since February 12, which was the peak in trading volume, confirming the pattern. At the time of writing, Vechain price is about $0.0507 just above the 26-EMA support level at $0.05 which has been a clear bullish indicator since February 8.
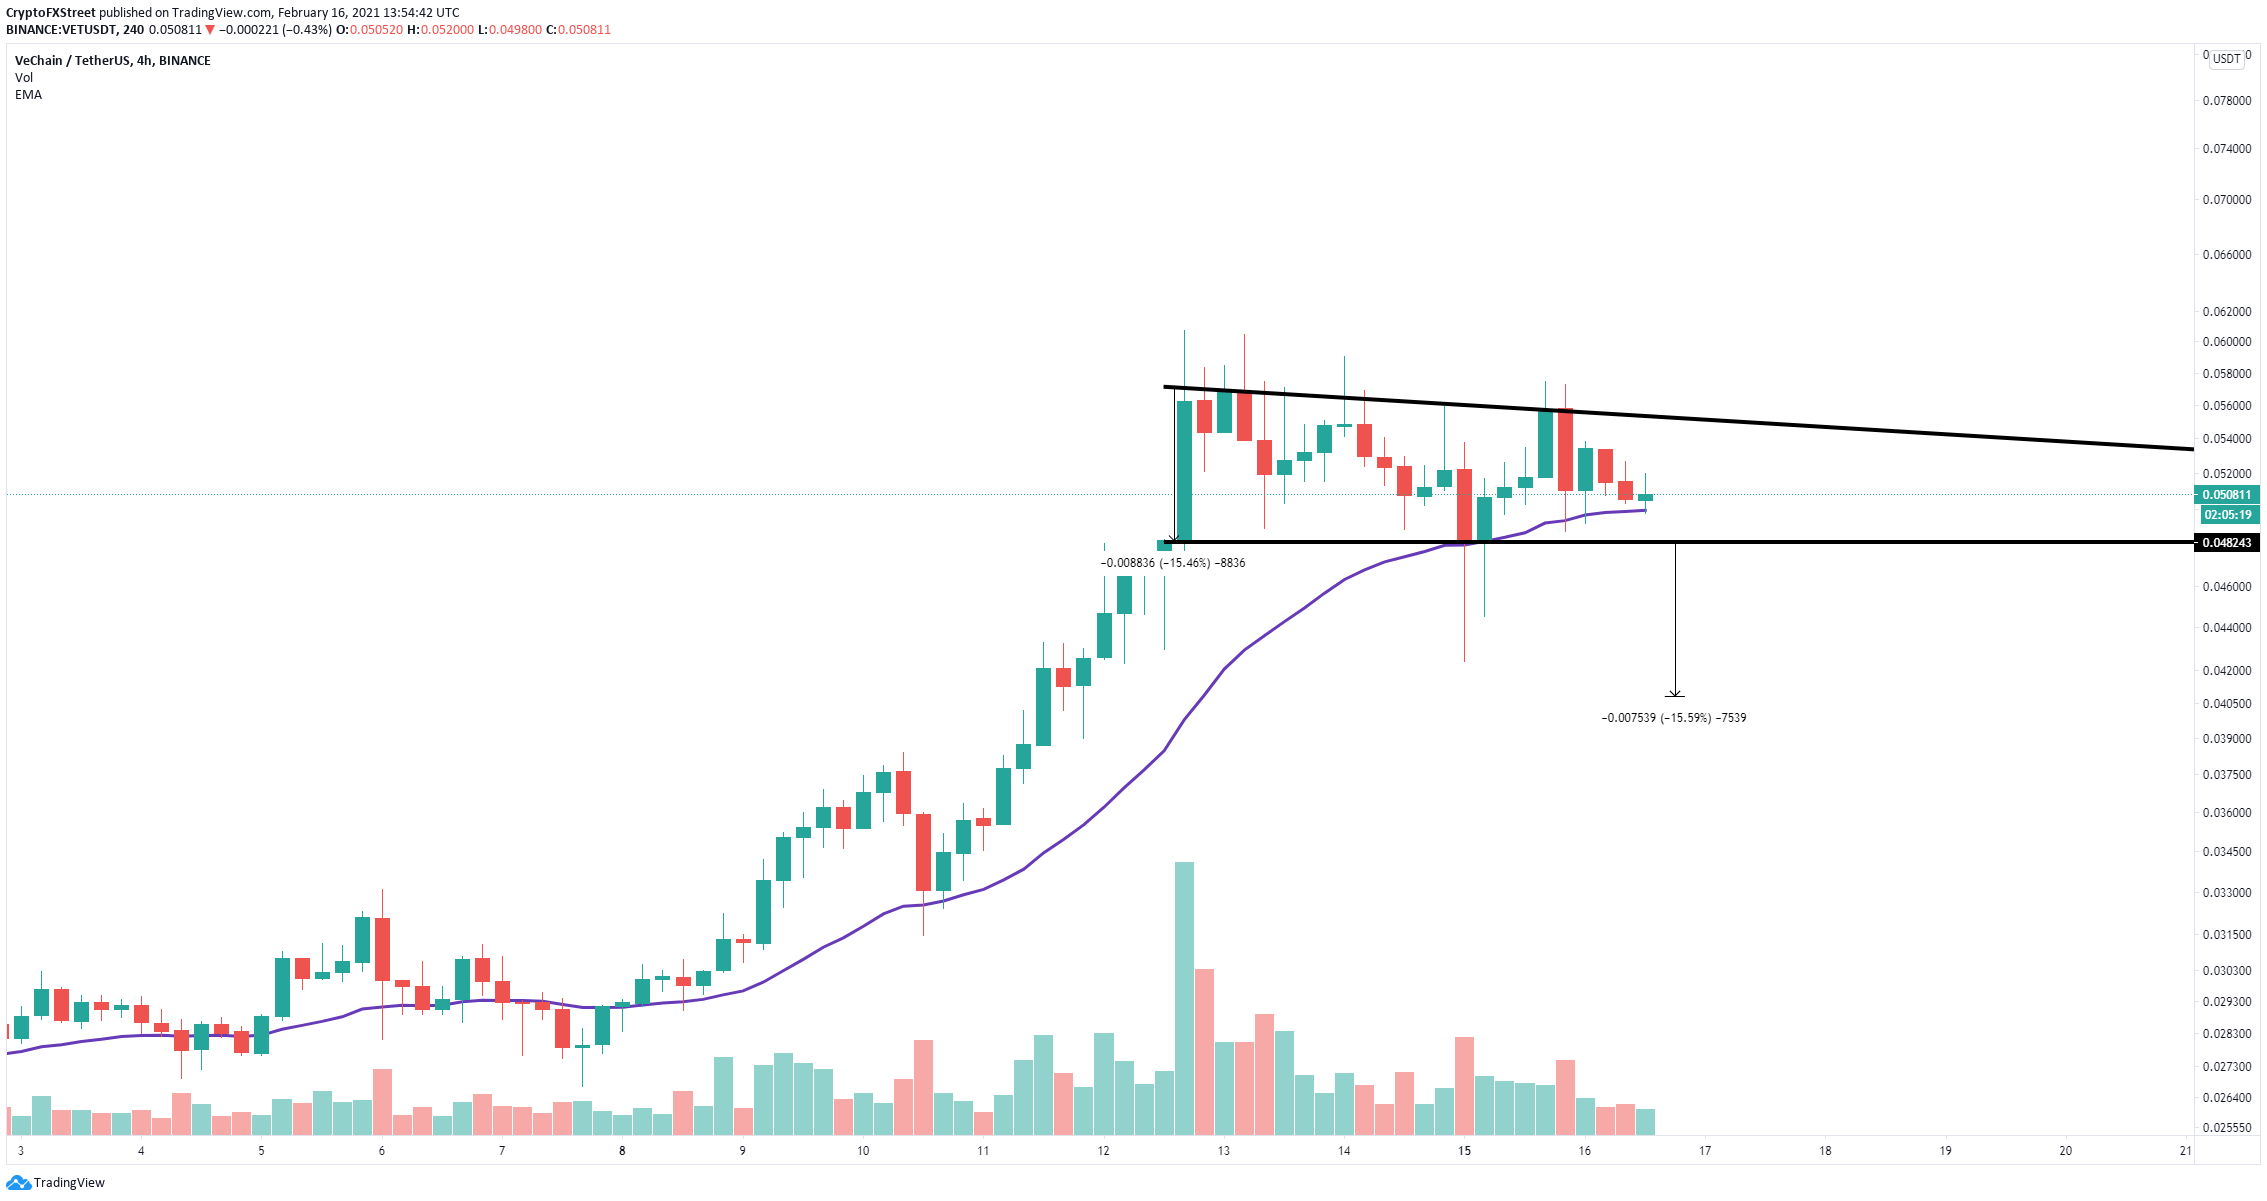
VET/USD 4-hour chart
Defending this key support level will quickly push Vechain price towards the upper trendline at $0.055. This is the most important resistance level before a potential 55% breakout towards new all-time highs at $0.085.

VET/USD 4-hour chart
To invalidate the bullish outlook, bears need to crack the 26-EMA support level which will easily push Vechain price down to $0.048 at the lower trendline support of the descending triangle pattern. A breakdown below this point would lead VET into a 15% drop towards $0.04, calculated by using the height of this pattern as a reference point.
Author

Lorenzo Stroe
Independent Analyst
Lorenzo is an experienced Technical Analyst and Content Writer who has been working in the cryptocurrency industry since 2012. He also has a passion for trading.


