Uniswap Technical Analysis: UNI leads DeFi sector recovery as another bullish pattern breaks out
- Uniswap is nurturing an uptrend with a target at $5 amid improving technical indexes.
- According to Santiment, whales are on a buying spree, adding pressure to the tailwind.

Uniswap has recovered tremendously in November, spiking 143% from the monthly low at $1.75 to the recent peak at $4.27. The bullish outlook seems unstoppable, mainly due to a bull flag breakout observed on the 4-hour chart.
Uniswap nurtures upswing to $5
The decentralized finance (DeFi) sector is waking up from the trip made downstream in September and October. Uniswap is among tokens that are leading this recovery mission. However, resistance at the monthly peak has seen bulls lose traction and the price dive to $3.2 (recent critical support).
A bull flag pattern came into the picture and highlighted the possibility of the uptrend continuing. Meanwhile, UNI/USD has broken above the bullish pattern and is trading at $3.9 at writing. This pattern brings to light a potential upswing to $5 if the ongoing uptrend is sustained.
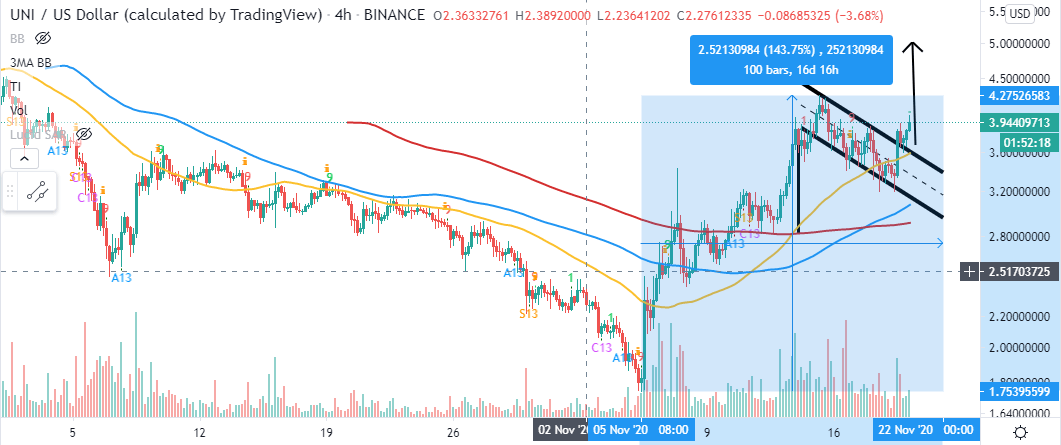
UNI/USD 4-hour chart
A golden cross pattern was recently formed by the 50 Simple Moving Average crossing above the longer-term 200 SMA, hence validating the uptrend. If UNI closes the day above the 100 SMA in the same 4-hour timeframe, the price may continue to rally upward as more buyers join the market in anticipation of liftoff to higher levels.
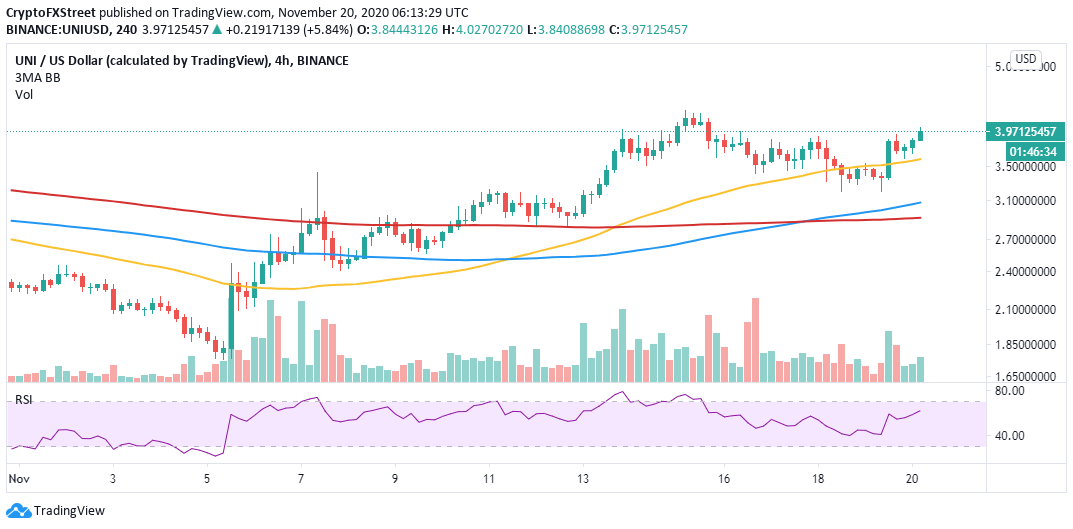
UNI/USD 4-hour chart
The buying pressure behind Uniswap has been rising over the last 30 days, according to Santiment. The number of whales holding between 100,000 and 1 million UNI increased from 121 to 132, while addresses boasting of 1 million to 10 million UNI rose from 49 to 52.
This increase may seem insignificant at a glance, but the volume moved by the whales is massive. Therefore, Uniswap is likely to continue with the rally if buying pressure from the whales intensifies.
 [09.37.54, 20 Nov, 2020]-637414510867978900.png)
Uniswap holder distribution chart
It is worth mentioning that the uptrend towards $5 depends on UNI's ability to hold above the 100 SMA on the 4-hour chart. Failure to do so might invalidate the bull flag breakout and pull the token to the support provided by the 50 SMA.
Author

John Isige
FXStreet
John Isige is a seasoned cryptocurrency journalist and markets analyst committed to delivering high-quality, actionable insights tailored to traders, investors, and crypto enthusiasts. He enjoys deep dives into emerging Web3 tren