Uniswap Price Forecast: UNI composed for a 16% upswing to $3.2
- Uniswap bulls push for a breakout to $3.2 amid an increase in buying pressure.
- The symmetrical triangle pattern seemingly imminent breakout adds credence to the bullish narrative.

Uniswap has started to nurture an uptrend after buyers barricaded the zone at $2.5, halting declines from causing more damage. A recovery also ensued from the support, lifting UNI towards $3. Resistance at $2.9 could not permit buyers to hit highs above $3. A little retreat came into the picture, pulling the decentralized finance (DeFi) token to the short-term support at $2.5. For now, the path of least resistance seems to be on the upside, especially if UNI can hold onto the uptrend above the triangle.
Uniswap ready for the ultimate liftoff to $3.2
UNI is changing at $2.8 while battling the selling pressure presented by a symmetrical triangle pattern. Price action above the upper trendline might kick start a rally, leading to a 16% upswing to $3.2. The Relative Strength Index adds credibility to the bullish outlook by drawing closer to the overbought area. If the price makes it above the next short term resistance at $2.9, buy orders are likely to increase, adding force to the tailwind.
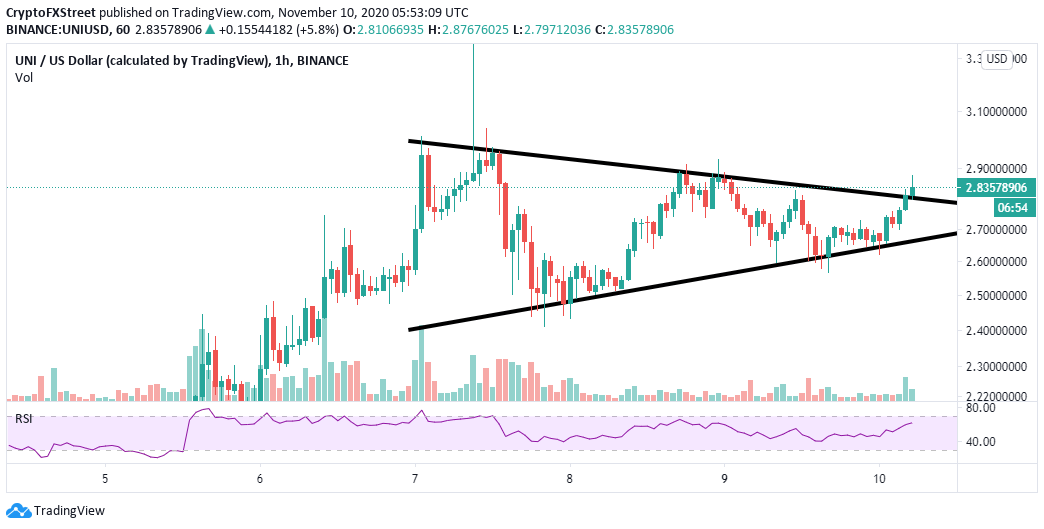
UNI/USD 1-hour chart
A golden cross formed when the 100 Simple Moving Average crossed above the longer-term 200 SMA also reinforces the bullish breakout. Moreover, Uniswap has also settled above the 50 SMA. On the other hand, the Moving Average Convergence Divergence shows that the price is firmly in the bulls’ hands. A bullish divergence above the MACD indicates that buyers have more influence over UNI; therefore, the uptrend is likely to extend higher.
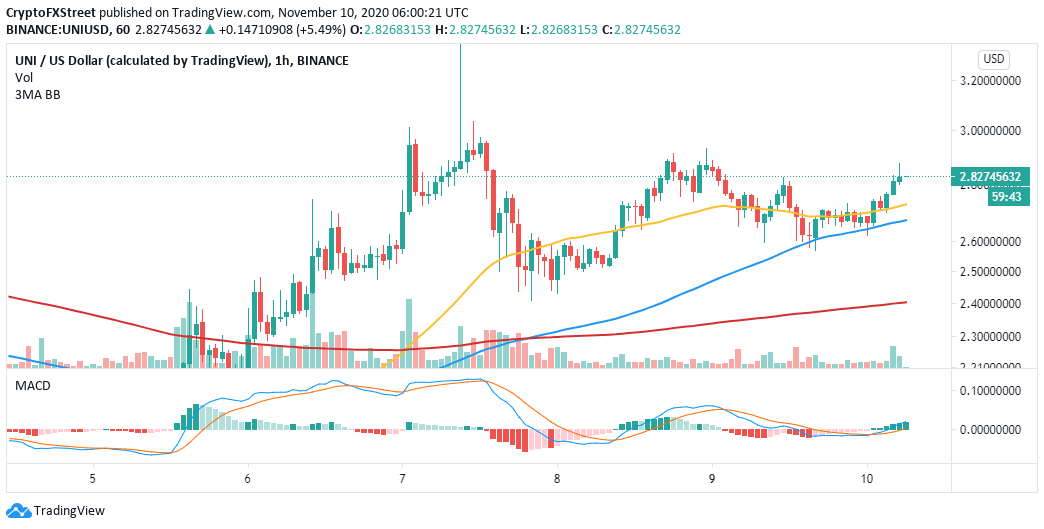
UNI/USD hour chart
According to the IOMAP model by IntoTheBlock, Uniswap has a relatively clear path to $3. The most robust seller congestion zone runs from $3.16 to $3.25. Here, roughly 1,800 addresses had previously bought approximately 15 million UNI.
On the downside, support is presented between $2.6 and $2.7. Here, about 2,100 addresses had previously purchased 22.7 million UNI. The immense support in this zone seems enough to absorb most of the selling pressure from a break down at the current price level. Therefore, the path with the least hurdles is upwards.
-637405864437812411.png)
Uniswap IOMAP chart
It is worth noting that that bullish outlook will be invalidated if UNI fails to sustain the uptrend above the symmetrical triangle. If the price swings back into the pattern, sell orders are bound to rise, adding pressure to the IOMAP crucial support between $2.6 and $2.7. The initial technical support at the 50 SMA must also ensure that UNI does not shift the focus to $2.6 and $2.5.
Author

John Isige
FXStreet
John Isige is a seasoned cryptocurrency journalist and markets analyst committed to delivering high-quality, actionable insights tailored to traders, investors, and crypto enthusiasts. He enjoys deep dives into emerging Web3 tren


