Top 3 Price Prediction Bitcoin, Ethereum, XRP: Crypto markets indecisive and confused
- Bitcoin price action gives mixed signals as bulls and bears both find opportunities.
- Ethereum price threatens a 20% drop while simultaneously creating a bull flag.
- XRP maintains critical support despite a powerful bearish continuation setup.

Bitcoin price is positioned at a level where strong signals can be made for both long and short biases. Ethereum price has a make-or-break level at $3,800. XRP finds and holds support against two key Fibonacci levels despite bearish Ichimoku conditions.
Bitcoin price is bullish on the weekly chart but bearish on the daily
Bitcoin price shows several mixed signals as it approaches the end of the week. On Bitcoin’s weekly chart, fears of the beginning of a bear market may have abated somewhat. However, bulls appear to want to hold the 50% Fibonacci retracement ($48,000) and the weekly Kijun-Sen ($49,000) as a near-term support level. The oscillators certainly help confirm solid support for the $48,000 - $49,000 levels.
The Relative Strength Index is currently testing the first oversold level in a bull market, 50. Most important, however, is the position of the Composite Index. When comparing the Composite Index swing low on the week of September 24th and its candlestick position to the current Composite Index swing low and its candlestick, there is a difference in structure.
The Composite Index shows lower lows while the candlestick chart shows higher lows. This is a condition known as hidden bullish divergence – a warning sign that the current, short-term downside movement in Bitcoin price is likely to terminate soon and resume its uptrend. The same hidden bullish divergence is also present in the Relative Strength Index, albeit to a lesser degree. The confluence of hidden bullish divergence in the oscillators while Bitcoin finds support on the candlestick chart gives credence to a likely incoming bullish reversal.
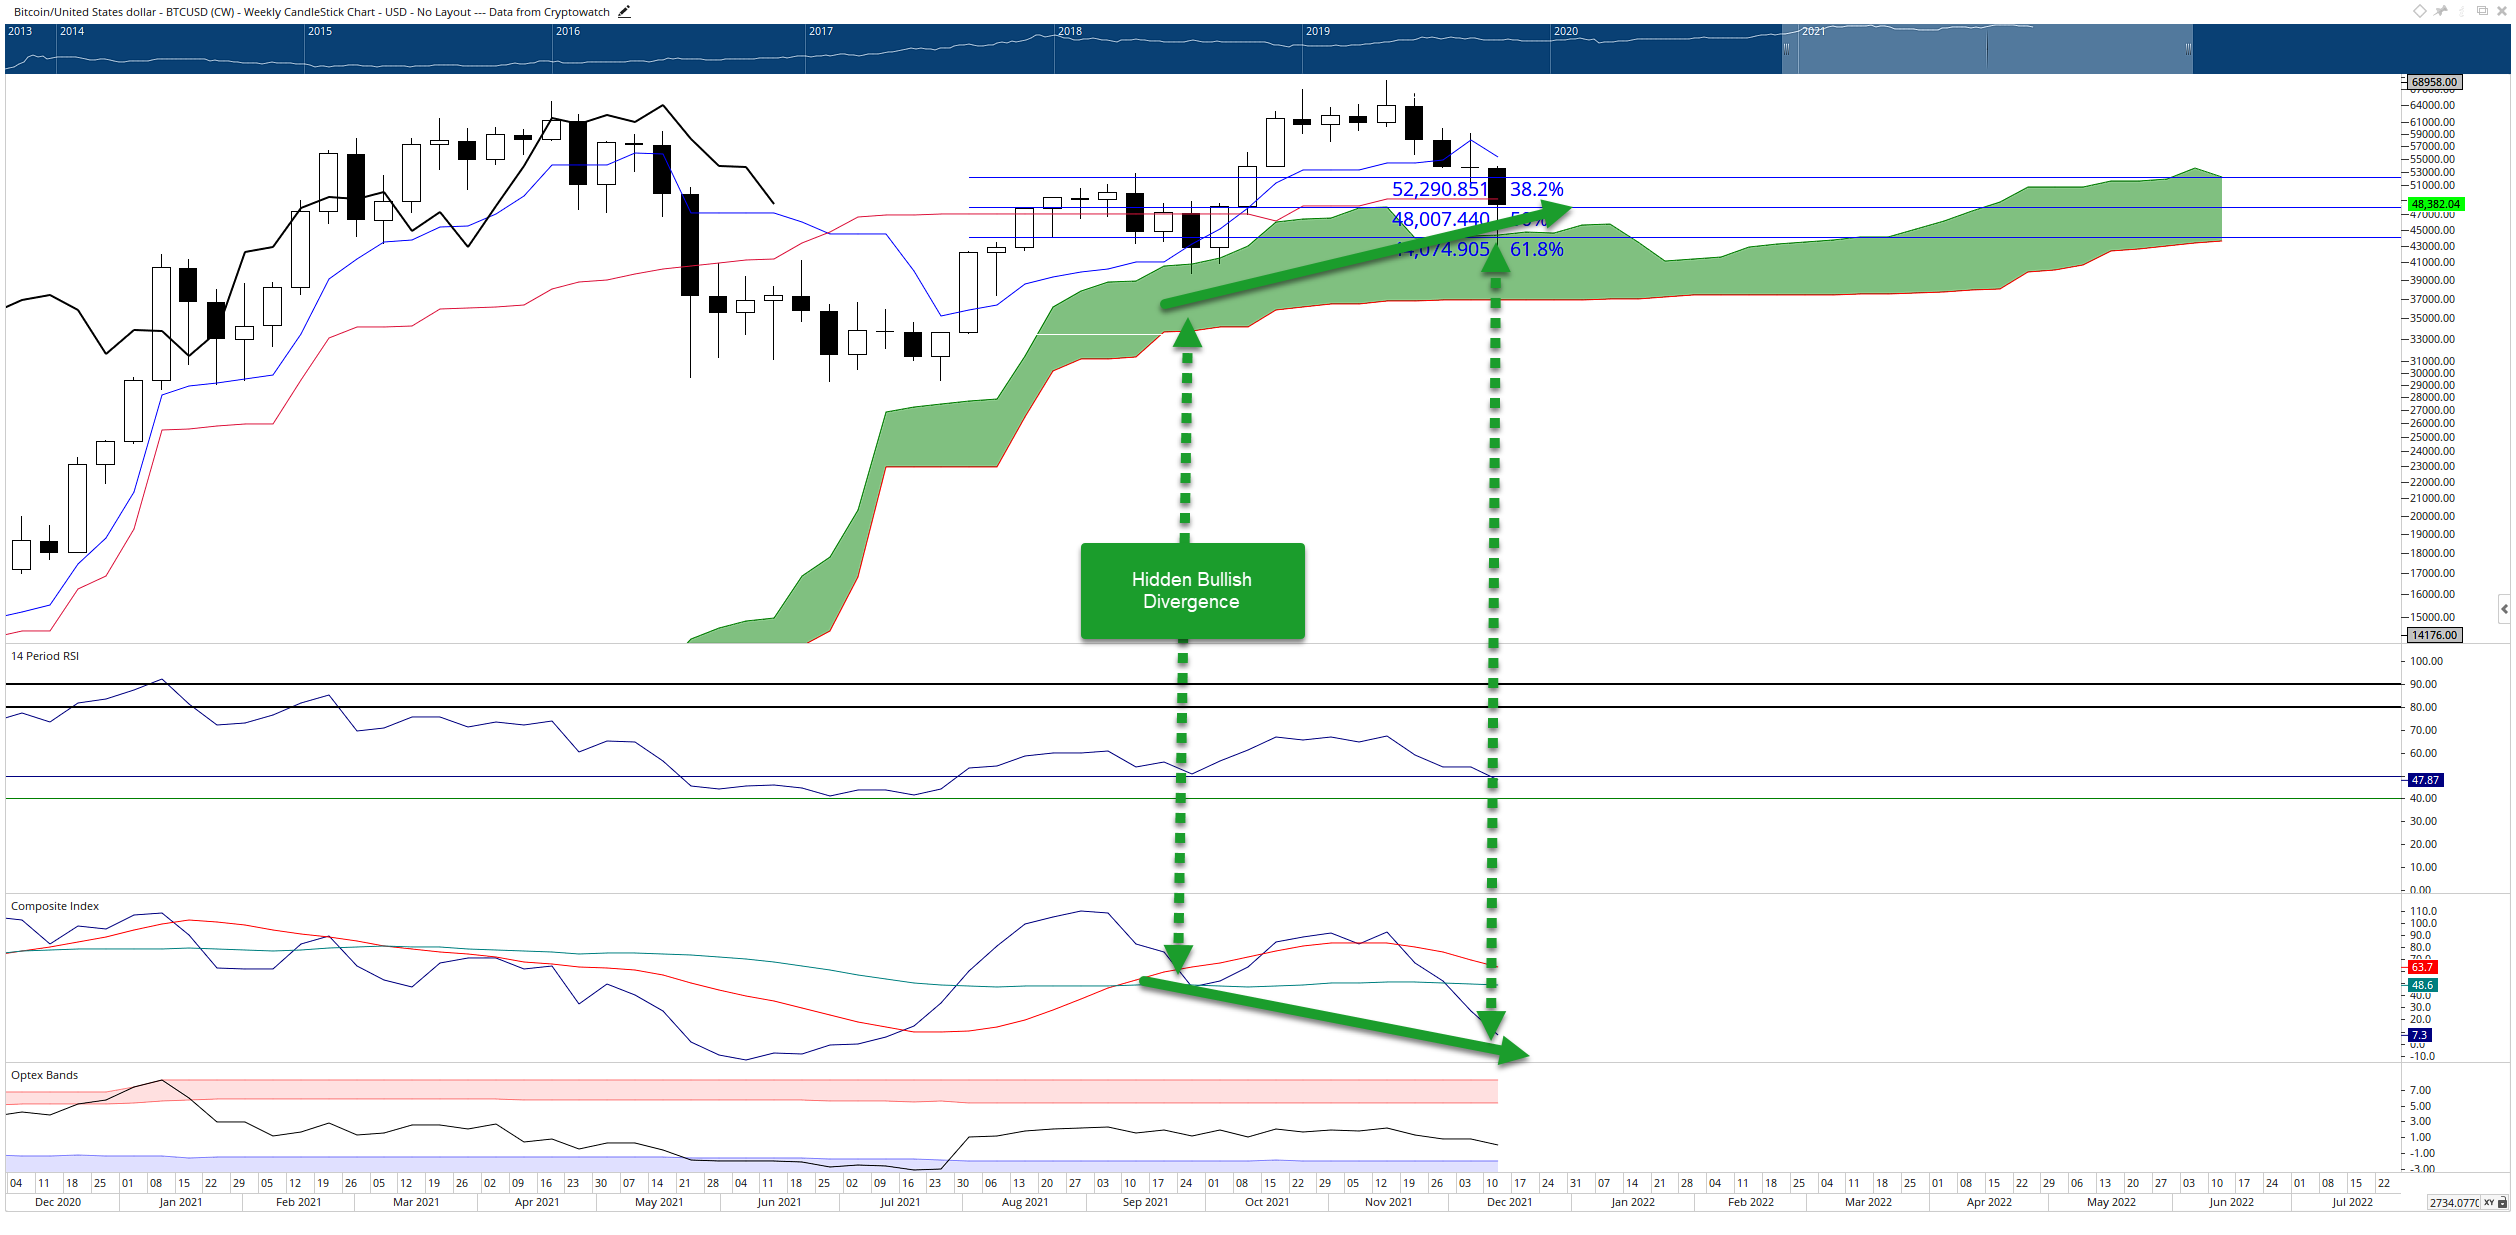
BTC/USD Weekly Ichimoku Chart
However, some bearish warning signs for Bitcoin price do exist. While the weekly chart is more important and more relevant when compared to the daily chart, broad trend changes occur on faster timeframes before they occur on more extended time frames. The daily chart could be hinting at a shift towards a bear market.
On its daily chart, Bitcoin is currently in an overwhelmingly bearish trading environment within the Ichimoku Kinko Hyo system. Bitcoin price is below the Cloud (Senkou Span A and Senkou Span B), the Kijun-Sen, and the Tenkan-Sen. Future Senkou Span A is below Future Senkou Span B, and the Chikou Span is below the candlesticks and in open space. Every marker for a bearish Ichimoku chart is present.
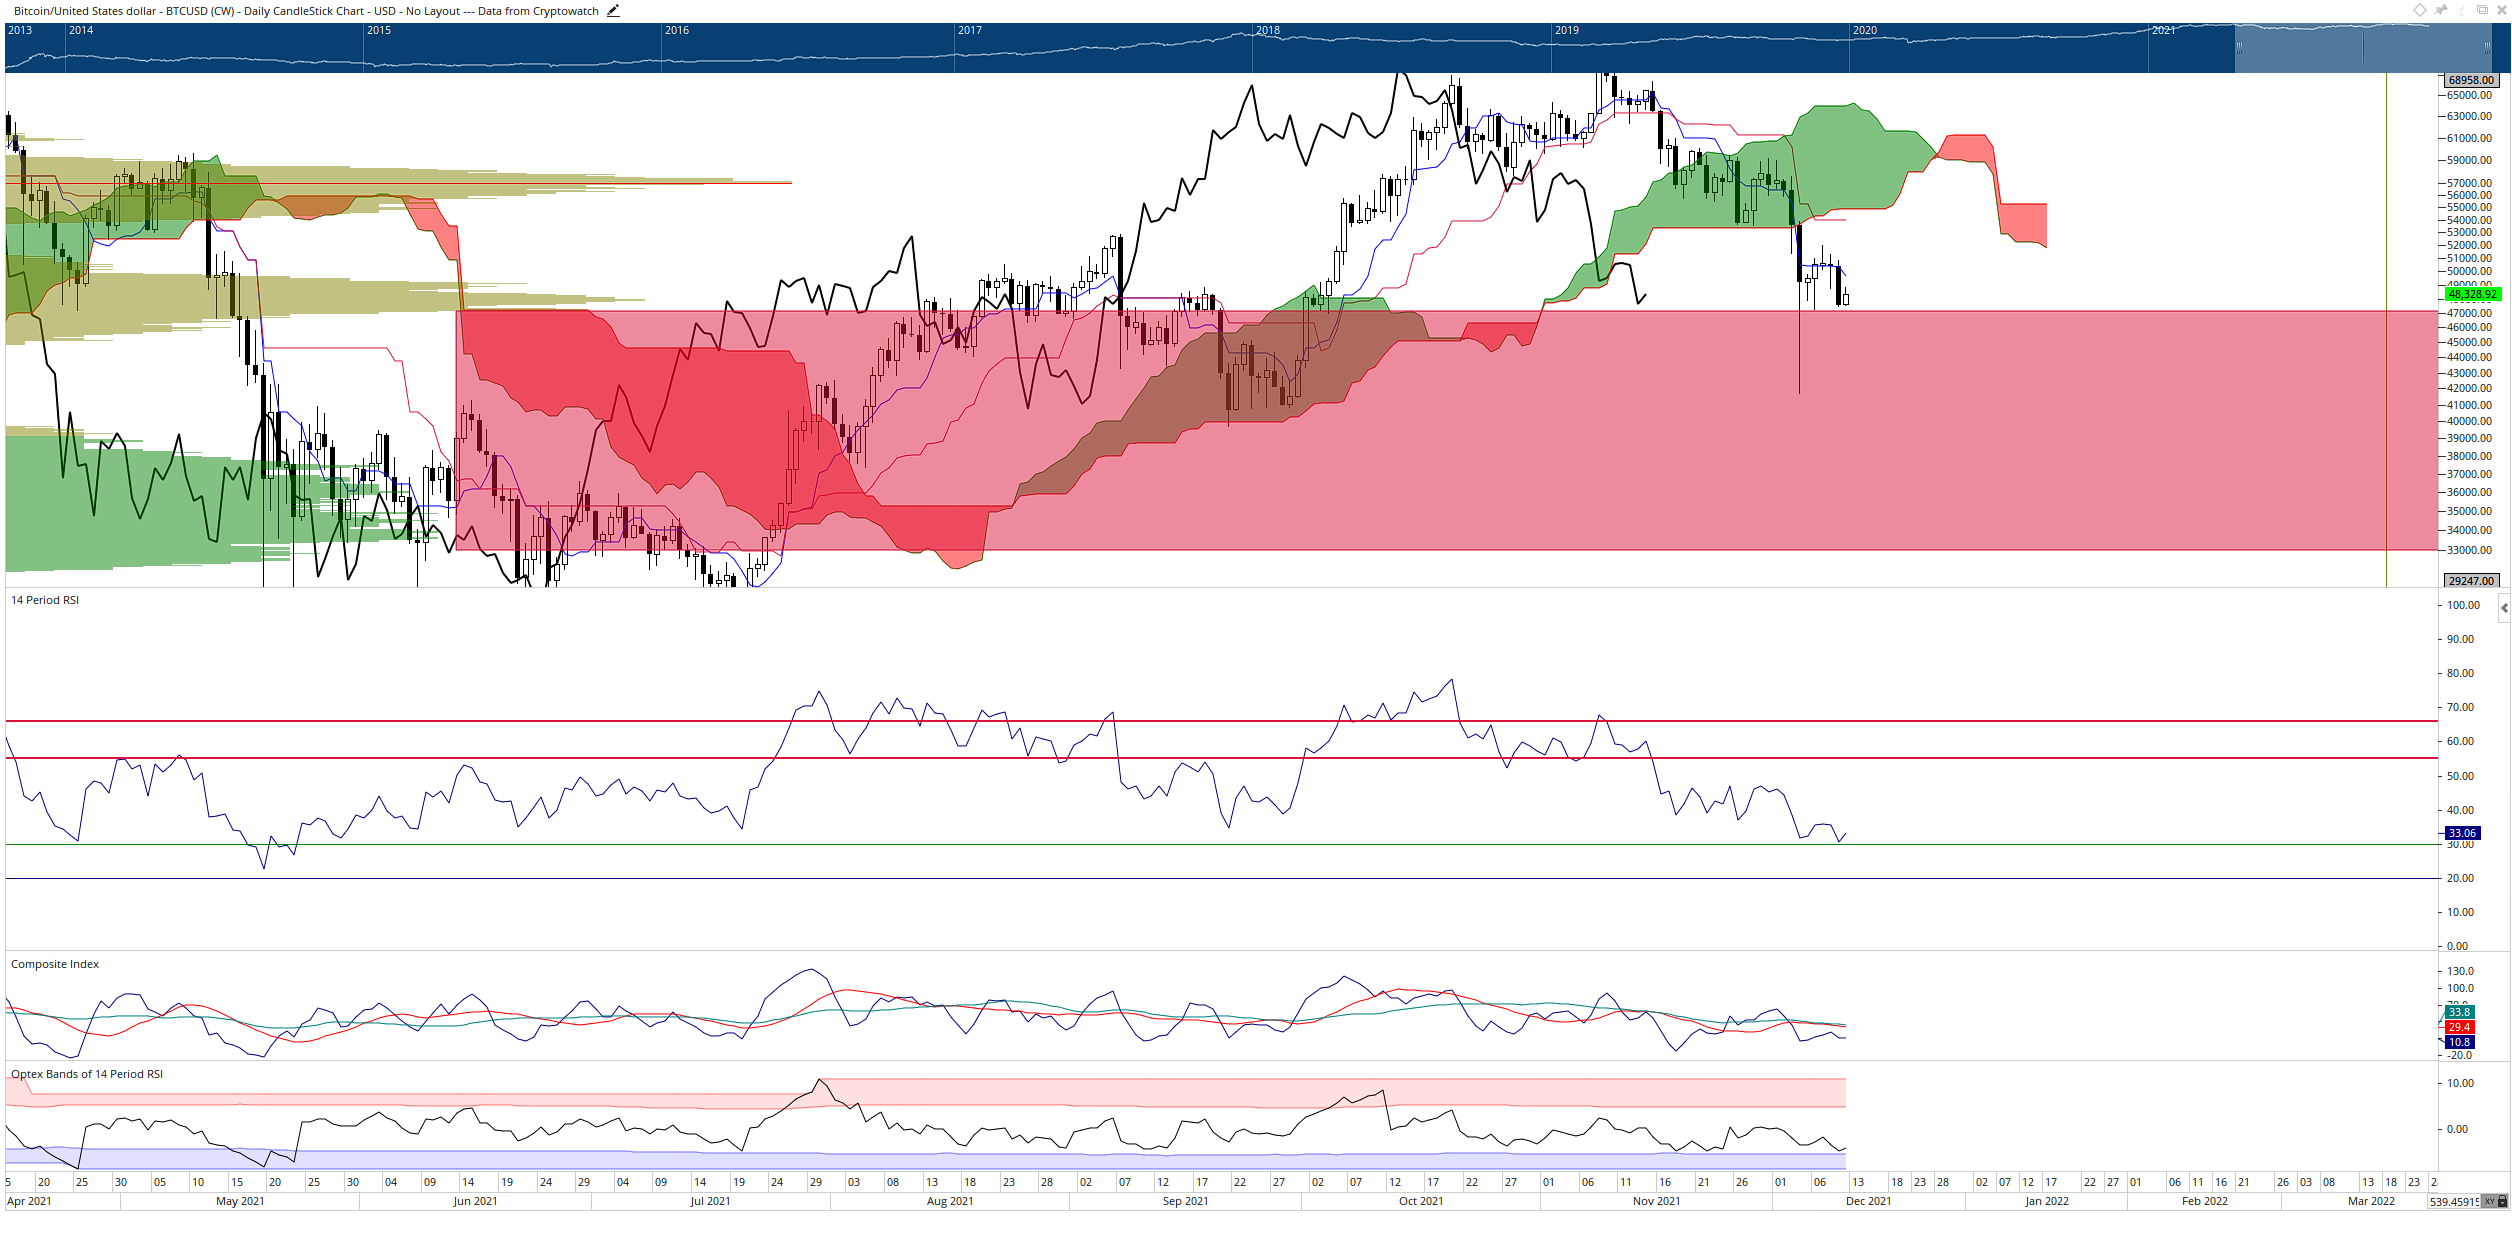
BTC/USD Daily Ichimoku Chart
The shaded area on the chart above is the most significant nearby threat for Bitcoin price. There is a significant gap between two high-volume nodes in the 2021 volume profile between $47,000 and $33,000. Bitcoin is just barely holding onto that final support zone.
Ethereum price to retest $3,800 before confirming support or a collapse
Ethereum price faced overwhelming rejection against the top of the Cloud (Senkou Span A) and the bottom of a prior bear flag on Thursday. As a result, Ethereum’s daily close was just a hair below the daily Tenkan-Sen and Kijun-Sen, as well as the dominant interior trend line (black diagonal line). Failure to hold the $4,200 level as support points to Ethereum returning to $3,800.
$3,800 is the final major test for Ethereum. There is a trifecta of support at $3,800 with the bottom of a bull flag, the bottom of the Cloud (Senkou Span B), and the 100% Fibonacci expansion all sharing that price level. Confirmation of Ethereum price finding support there would likely begin the process of a bullish breakout. Consequently, the three support levels appear again in their inverse at the $4,450 level.
Ethereum price will need to break out above the upper bull flag line, top of the Cloud (Senkou Span A), and the dominant interior angle at $4,450 to confirm a bullish breakout.
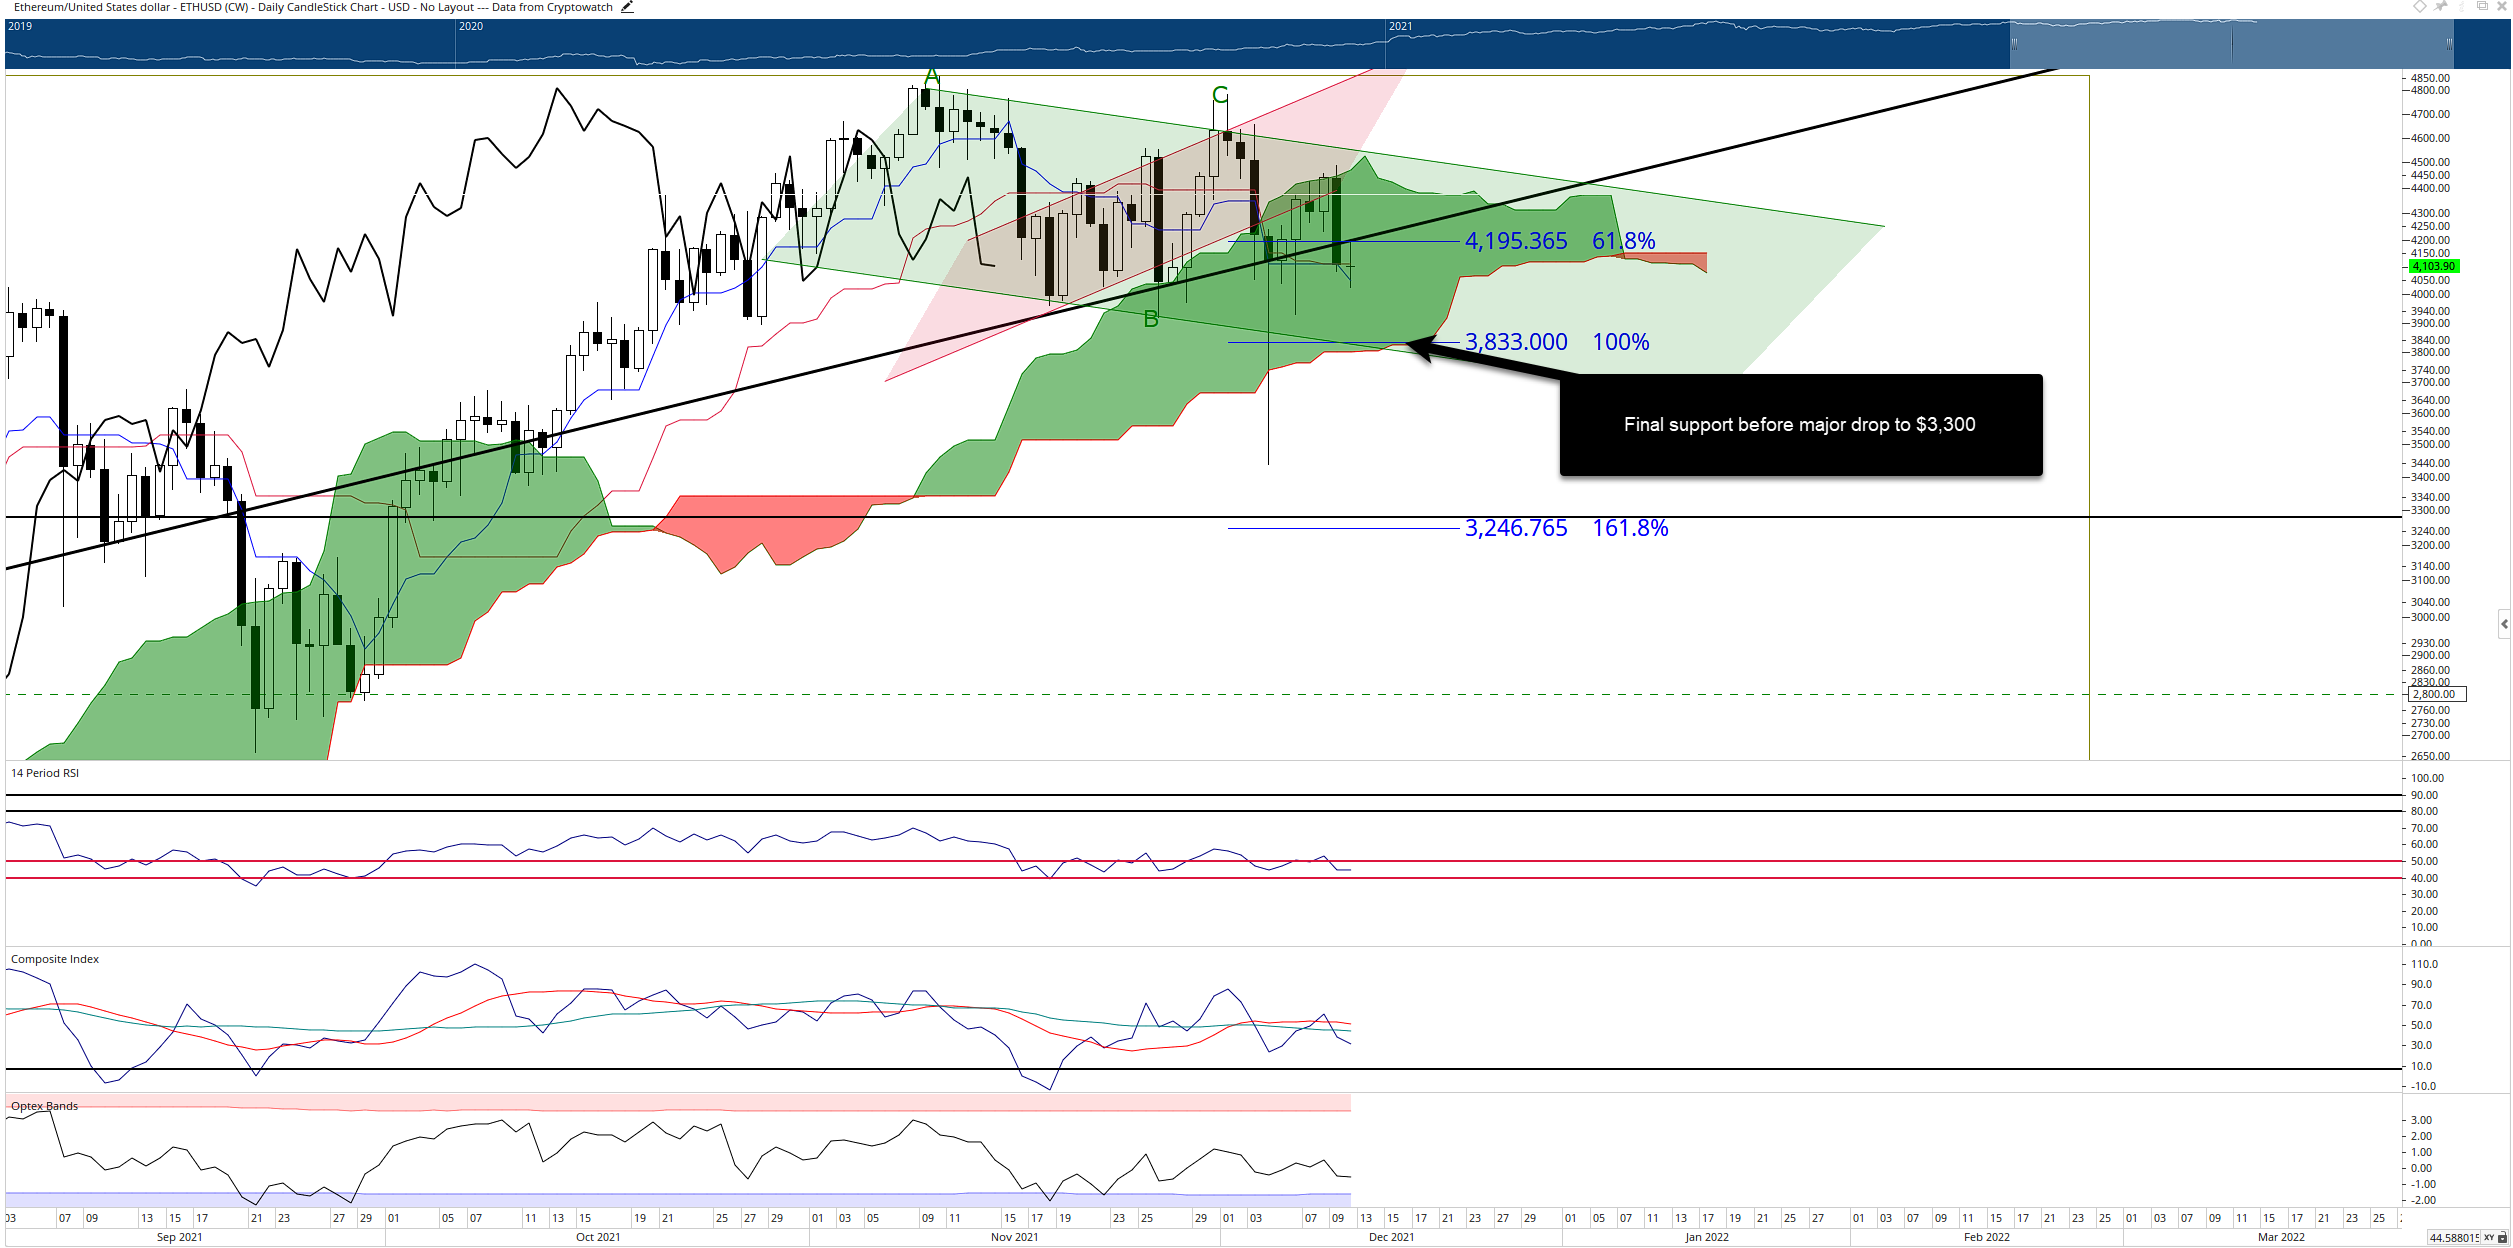
ETH/USD Daily Ichimoku Chart
However, failure to hold $3,800 as support means Ethereum will likely drop down to test the $3,300 value area where a high volume node and the 161.8% Fibonacci expansion exist.
XRP price action is the definition of indecision
XRP price is stuck between a rock and a hard place. Despite XRP’s Relative Strength Index shifting into bear market conditions, the price action may be telling traders a different story. The 100% Fibonacci expansion at $0.82 and the 38.2% Fibonacci retracement at $0.83 have been solid and immediate support for XRP.
Additionally, the Optex Bands oscillator has turned up and away from the extreme oversold conditions. At the same time, the Composite Index has crossed above both of its moving averages while in neutral territory.
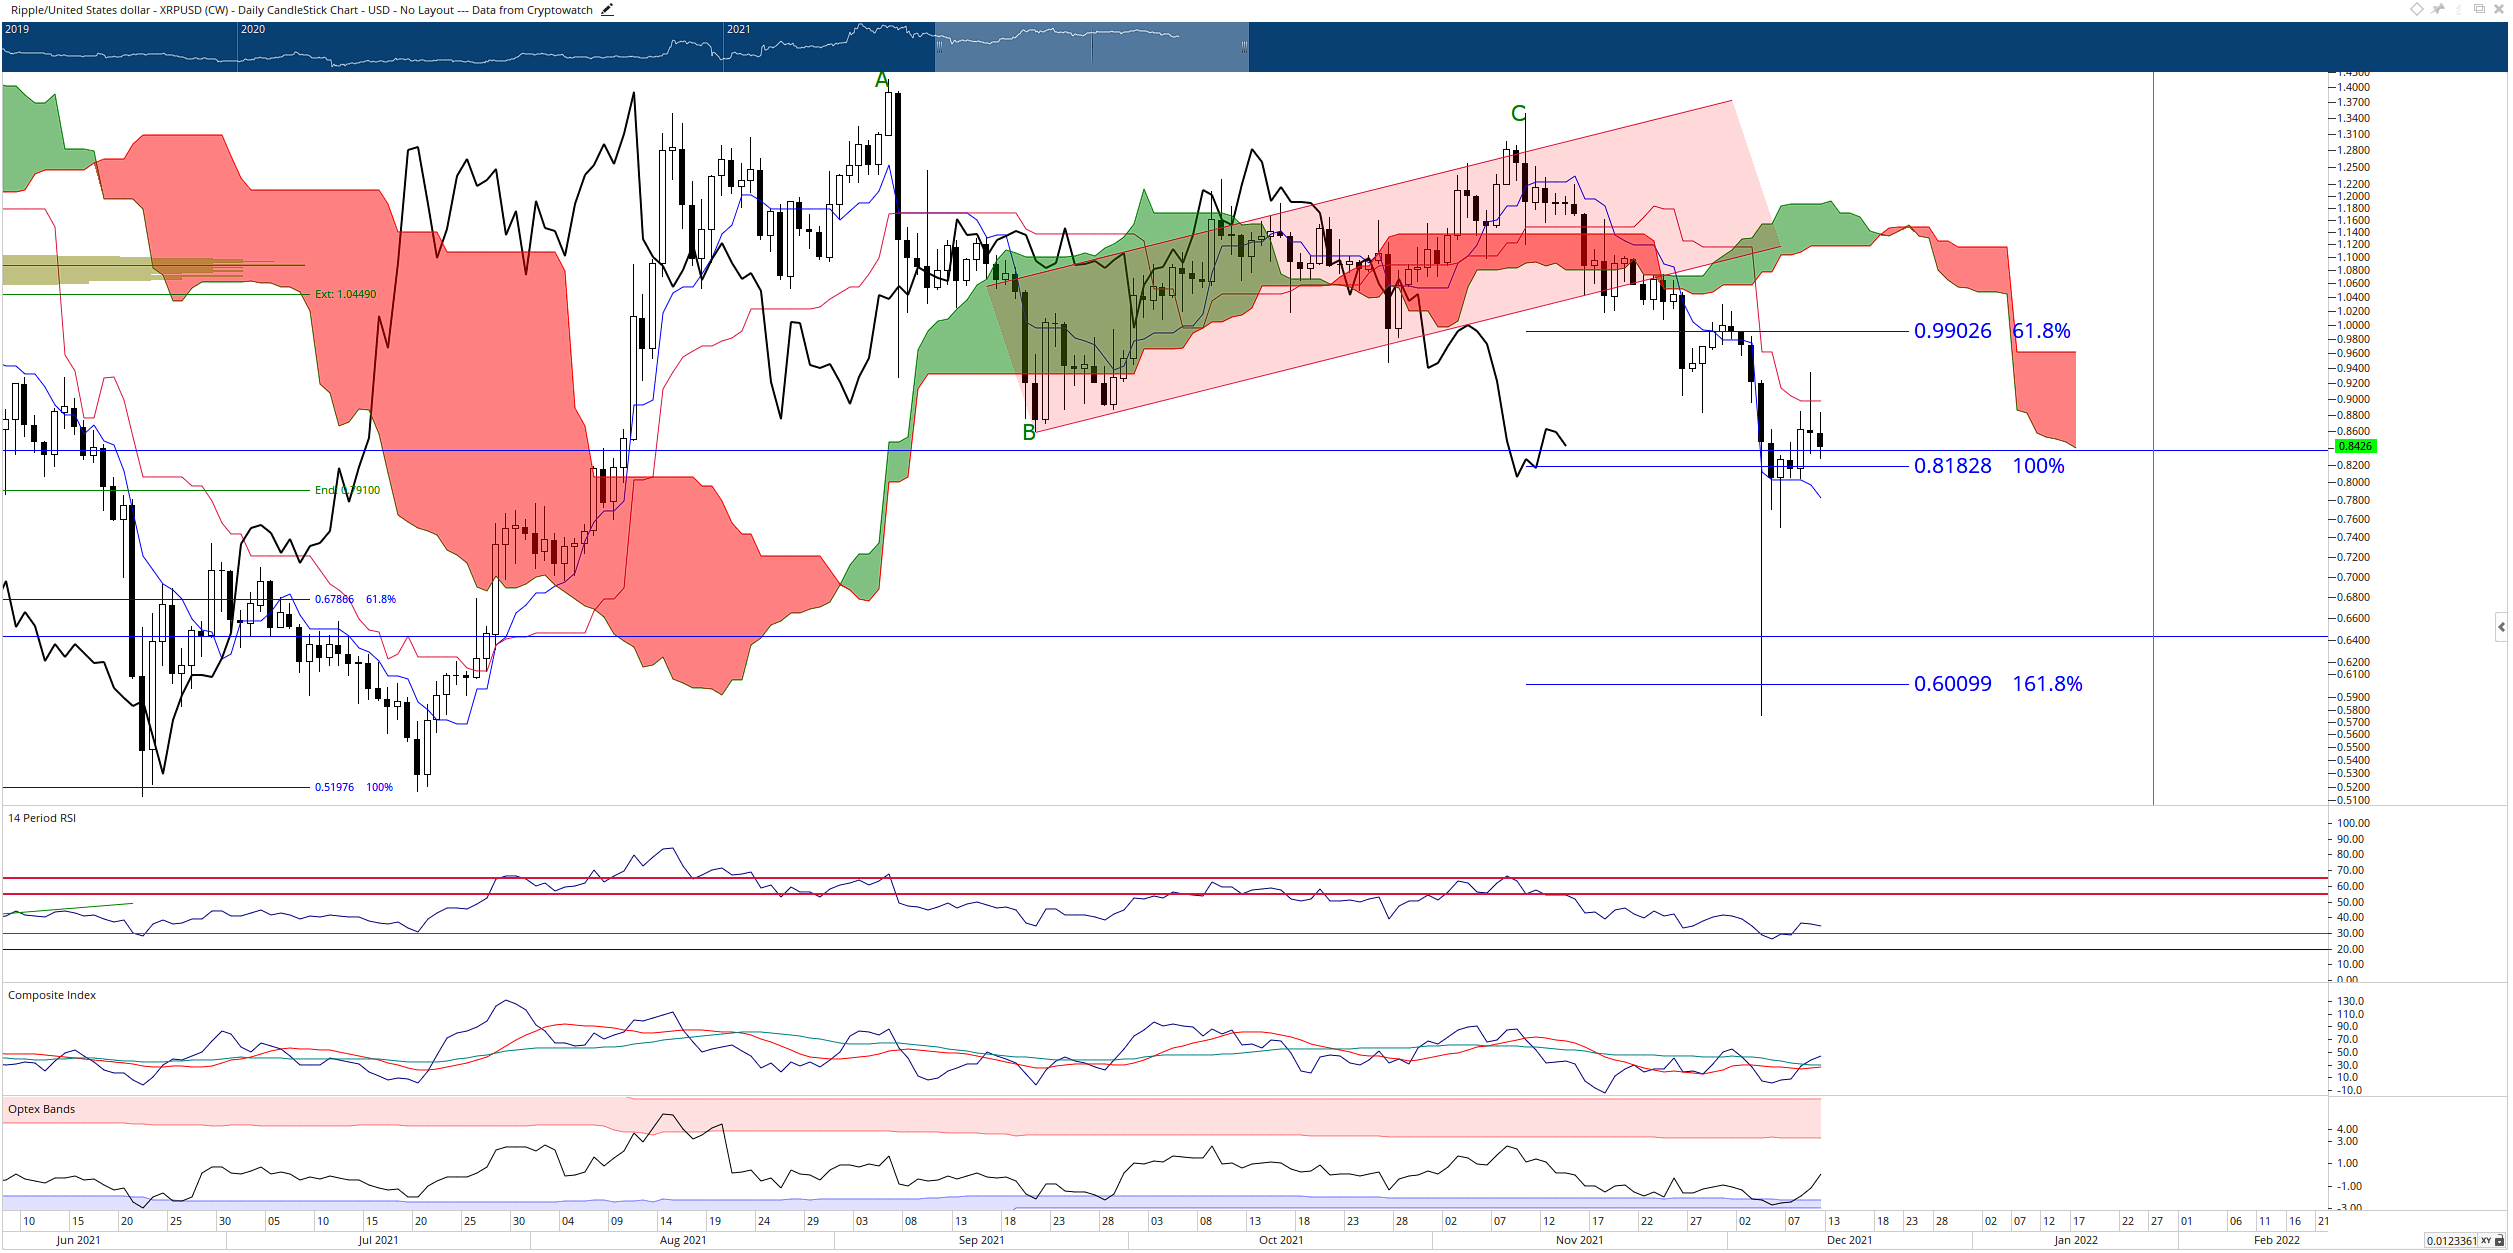
XRP/USD Daily Ichimoku Chart
If XRP price maintains support at $0.83, then a retest of the $1.00 value area is likely. However, any daily close below the $0.80 level would return XRP to the previous flash crash lows near $0.59.
Author

Jonathan Morgan
Independent Analyst
Jonathan has been working as an Independent future, forex, and cryptocurrency trader and analyst for 8 years. He also has been writing for the past 5 years.


