Top 3 Price Prediction Bitcoin, Ethereum, XRP: Crypto market dazed post flash crash
- Bitcoin price finds support against a combination of key price levels.
- Ethereum price returns inside the bear flag, creating mixed sentiment.
- XRP price is developing an insanely bullish reversal weekly candlestick.

Bitcoin price gets a big bounce off the $44,000 value area, moving more than $7,000 higher. Ethereum is now sandwiched between solid support and strong resistance. XRP price has one of the most potent and sought-after bullish reversal candlesticks forming on its chart: the hammer.
Bitcoin price retraces nearly all of Saturday's flash-crash
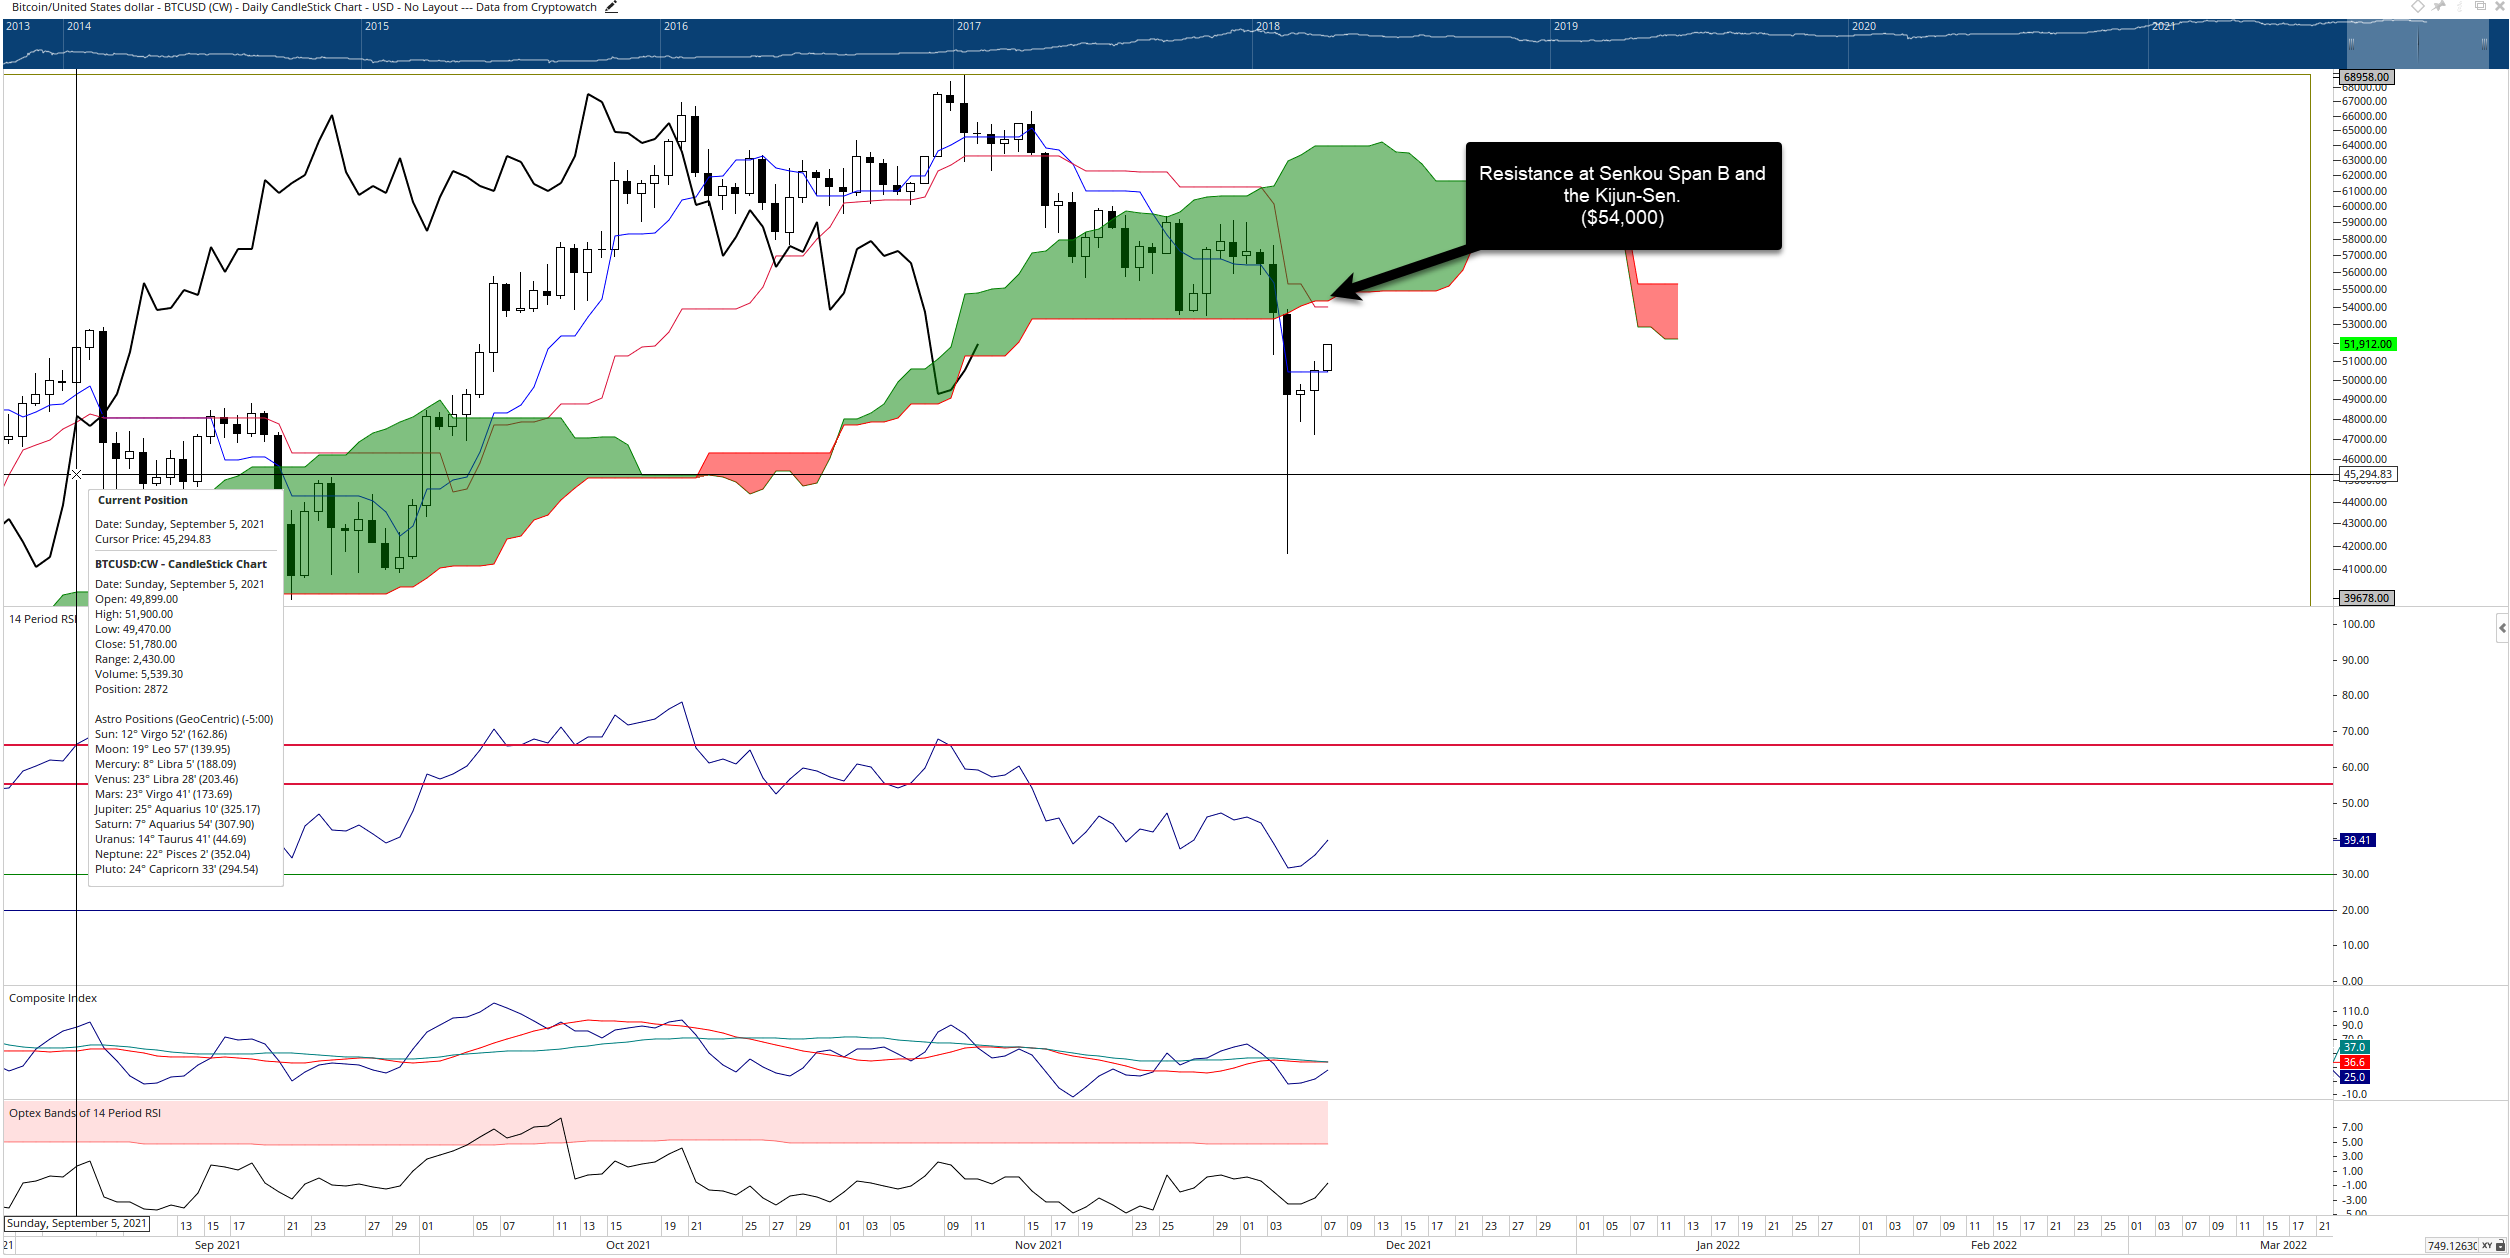
Bitcoin price action has been a strong performer since the recent flash crash. Significant support for Bitcoin was found where the 61.8% Fibonacci retracement and top of the Ichimoku Cloud (Senkou Span A) share the $44,000 price level. The support was strong enough to rally Bitcoin above the 50% Fibonacci retracement at $48,000 and the Kijun-Sen at $49,300.
BTC/USDT Weekly Ichimoku Chart
However, the upside potential may be limited. There is significant resistance within the Ichimoku Kinko Hyo system on the daily chart. The daily Kijun-Sen and Senkou Span B share the $54,000 price range. Longs may take profit at $54,000, and short-sellers may open up new short positions on any weakness. A close at or above $55,100 would like to remove any further near-term bearish sentiment.
Ethereum price between a rock and a hard place
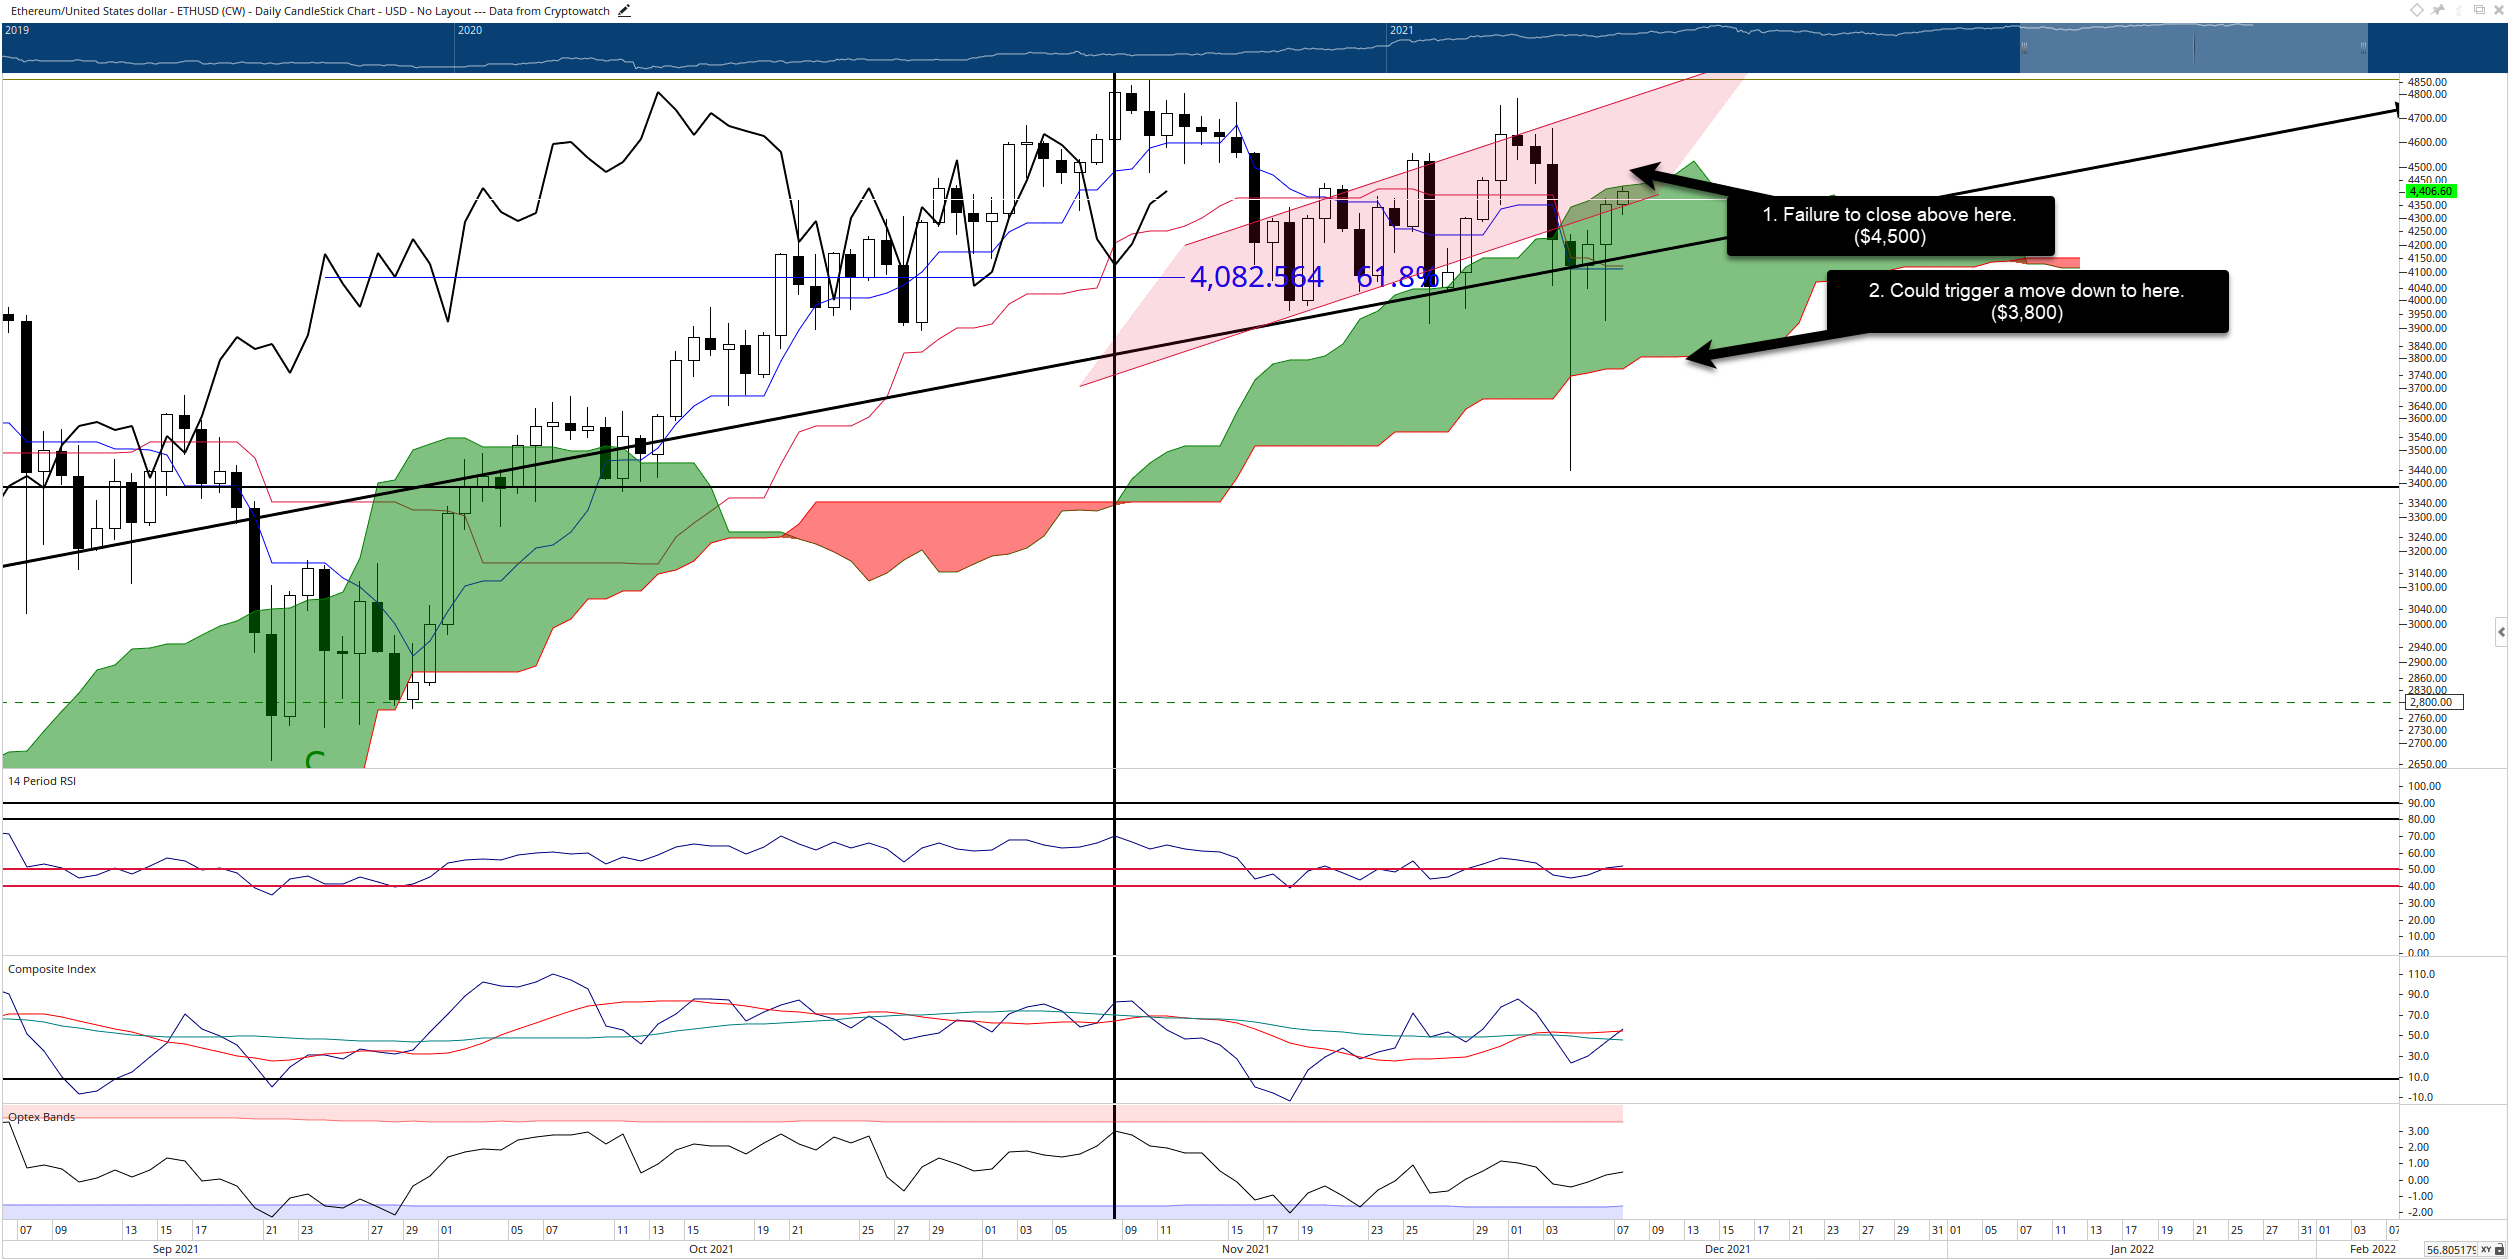
Ethereum price had a spectacular Saturday close on the daily chart, closing above the dominant interior trend line (black diagonal line). Then, on Sunday and Monday, Ethereum continues to press on higher with closes above the Tenkan-Sen and Kijun-Sen at $4,100. ETH has not returned inside the channel of the former bear flag but finds itself facing resistance against the top of the Cloud (Senkou Span A).
A close at or above $4,500 would put Ethereum price above the Cloud, but the Chikou Span would still be slightly below the candlesticks. However, the oscillators support a sustained breakout. So, if Ethereum does close to at least $4,500, there is enough momentum and space for it to move higher and get to a close that would position the Chikou Span above the candlesticks – to at least $4,725.
ETH/USDT Weekly Ichimoku Chart
From there, the $5,000 value are will likely be tested, and new all-time highs are likely soon after. However, any failure by Ethereum to successfully breakout above the Cloud could see a deeper retracement to test the bottom of the Cloud at Senkou Span B ($3,800).
XRP price weekly candlestick hints at a bullish reversal
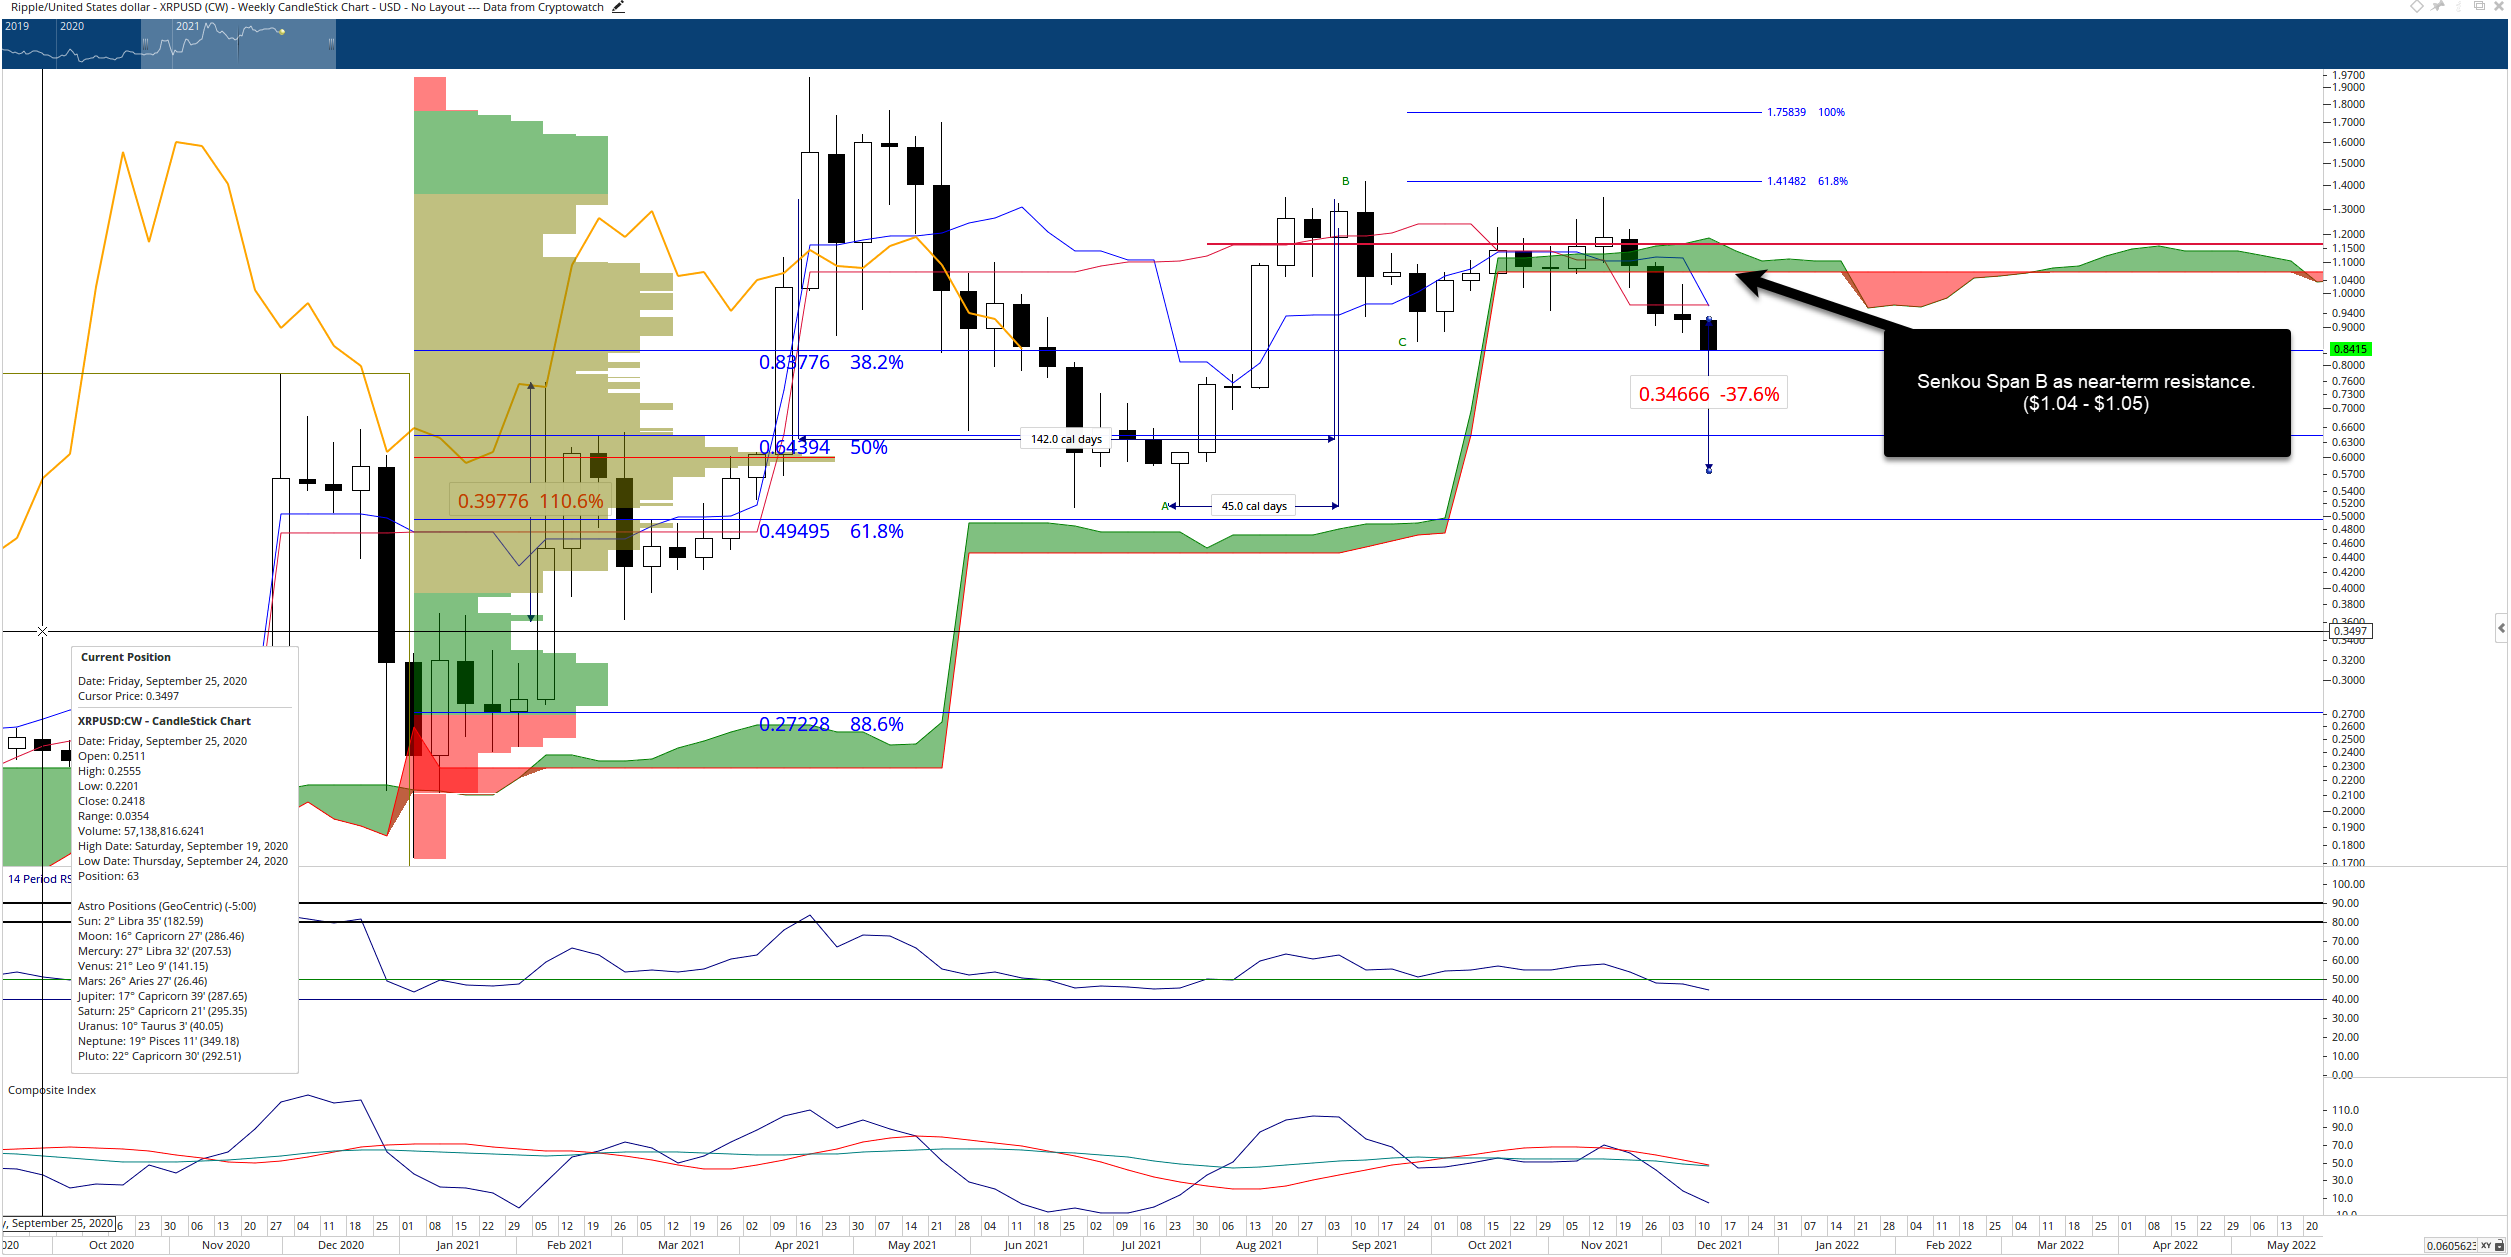
XRP price action suffered some of the most bearish price action during Saturday's flash crash. XRP dropped nearly 38% before finding massive support at the 50% Fibonacci retracement and 2021 Volume Point of control in the %0.65 value area. From there, it shot up higher, past the 38.2% Fibonacci retracement at $0.84 to settle just above that price level.
The resulting price action has created a bullish hammer candlestick pattern on the weekly chart. The positioning and timing of this pattern could not have been more fortuitous for XRP price. The hammer pattern will help confirm the likelihood of a bullish reversal with the Relatives Strength Index and Composite Index oscillators. Combining the bullish hammer, the Relative Strength Index between two support levels, and the Composite Index at a historical low gives XRP a very high probability of moving higher.
XRP/USDT Weekly Ichimoku Chart
Initial resistance will likely be Senkou Span B at $1.04. Given how long Senkou Span B has traded in a flat condition, if XRP can rally above, it will be a significant, bullish event.
Author

Jonathan Morgan
Independent Analyst
Jonathan has been working as an Independent future, forex, and cryptocurrency trader and analyst for 8 years. He also has been writing for the past 5 years.



![Zcash breaks above 2018 highs, eyes 1600–2500 [Video]](https://editorial.fxsstatic.com/images/i/crypto-coins-1.png)