Bitcoin Weekly Forecast: On the road to $60,000
- Bitcoin price retested and bounced off from the daily support level of $56,000 this week.
- US spot Bitcoin ETFs posted $140.7 million in inflows until Thursday and on-chain data supports a bullish outlook.
- The US Federal Reserve decision on Wednesday could be the next important catalyst for Bitcoin prices.

Bitcoin (BTC) has risen 6% so far this week, an upward trend that will likely continue following Wednesday’s successful retest of the $56,000 daily support level. A rally towards $60,000 looks likely in the upcoming week as US-listed spot Bition Exchange-traded Funds (ETF) registered net inflows and BTC’s exchange flow balance and supply on exchanges decreased. Still, Bitcoin’s fortunes will largely hinge on the US Federal Reserve’s (Fed) upcoming decision, a key event for traditional markets that has the potential to move cryptocurrencies as well.
Bitcoin rebounds amid modest demand from US ETFs
Institutional flows slightly supported Bitcoin’s price this week. According to Coinglass data, US spot Bitcoin ETFs experienced three days of inflow and one day of outflow until Thursday, totaling $140.7 million in net inflows. This slight increase in inflows shows a mild rise in institutional demand. The total Bitcoin reserves held by the 11 US spot Bitcoin ETFs rose slightly from $48.33 billion to $49.55 billion in Assets Under Management (AUM) this week.
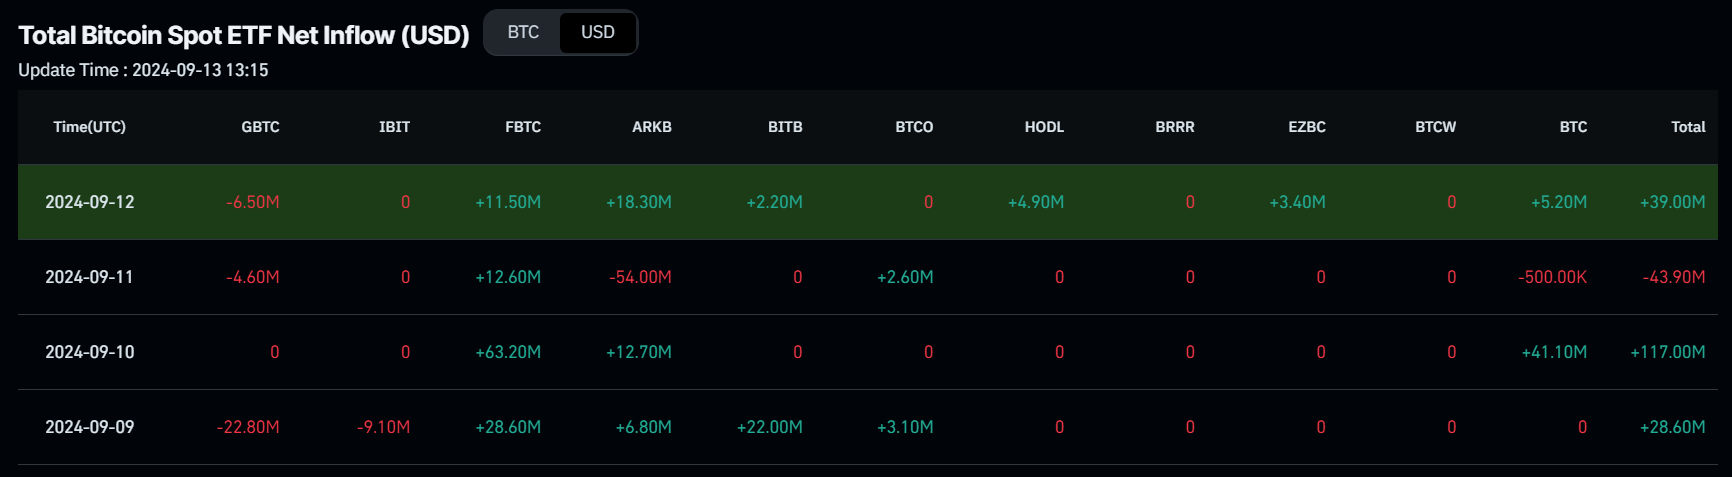
Bitcoin Spot ETF Net Inflow chart
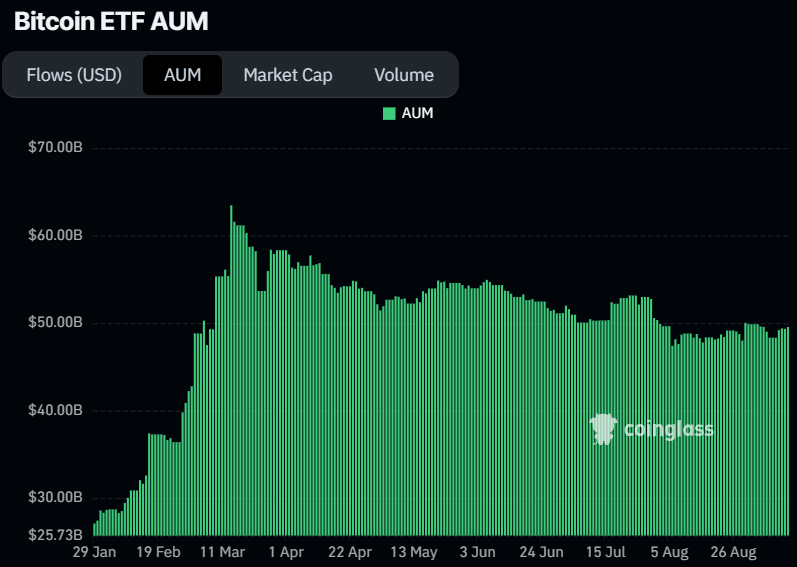
Bitcoin ETF AUM chart
On-chain metrics show signs of recovery
Bitcoin’s on-chain metrics show some signs of recovery, with both Santiment’s Exchange Flow Balance and Supply on Exchanges metrics projecting a bullish outlook.
The Exchange Flow balance index shows the net movement of tokens into and out of exchange wallets. A positive value indicates more BTC entered than exited, suggesting selling pressure from investors. Conversely, a negative value indicates more BTC left the exchange than entered, indicating less selling pressure.
Bitcoin’s Exchange Flow balance slumped to -25,751 on Tuesday from -8,668 on Monday. This further downtick into negative territory indicates increased buying activity among investors.
Additionally, the Supply on Exchanges index decreased from 1.89 million BTC on Tuesday to 1.86 million Thursday. This 1.58% fall in supply shows that holders are accumulating more BTC from exchanges to cold wallets, bolstering the BTC’s bullish outlook.
%20[12.38.40,%2013%20Sep,%202024]-638618260974365969.png)
Bitcoin Exchange Flow Balance and Supply on Exchanges chart
Experts see room for higher prices
Deutsche Bank analysts Marion Laboure and Sai Ravindran project that the Bitcoin price could remain high this year, according to a report published this week.
“We expect Bitcoin prices to remain high due to new ETF approvals, future central bank rate cuts, regulatory changes and a potential Trump presidency due to pro-crypto policies and preference for lower Fed funds,” they said.
Furthermore, the report also highlights that 78% of US consumers see cryptocurrencies as commodities, 76% as alternative assets, and 74% as a store of value. 65% see them as replacing cash. This survey also indicates that US consumers became more positive about crypto in 2024, with less than 1% thinking it is a fad.
Bitcoin's relationship with Gold and US dollar Index
Despite the recent positive outlook, this week’s CryptoQuant CQ report raises some concerns about Bitcoin's price. The report shows that the correlation between Gold and Bitcoin is decoupling. Bitcoin prices have declined while Gold prices have reached a fresh record high, causing a correlation between them to weaken.
“A period of negative correlation between Bitcoin and Gold, with Gold increasing and Bitcoin decreasing, typically signals a risk-averse environment where investors favor traditional safe-haven assets like Gold over speculative assets like Bitcoin,” the report says.
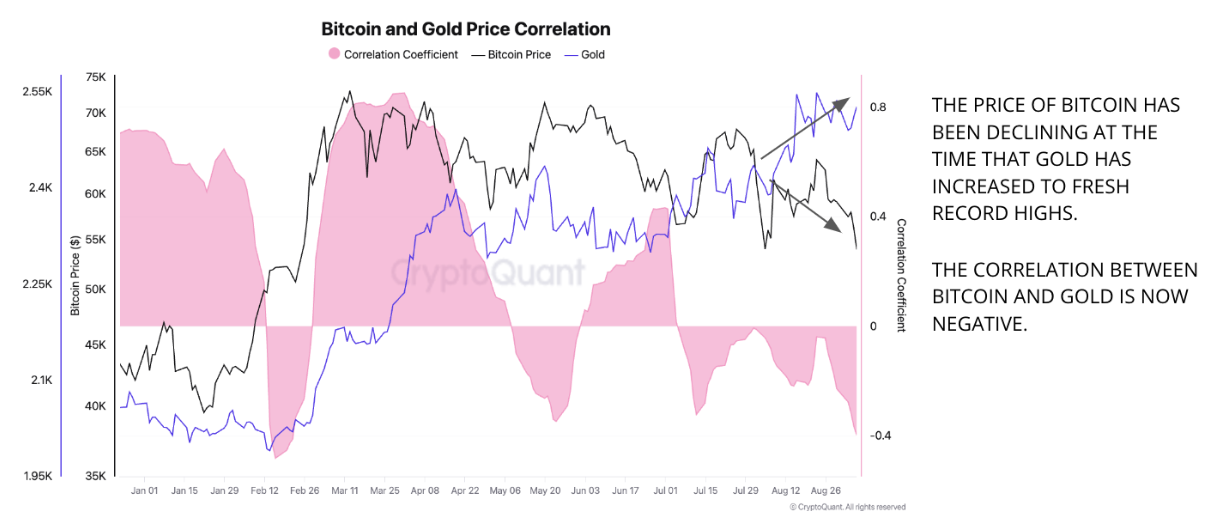
Bitcoin and Gold Correlation
Similarly, investors should be cautious about Bitcoin's coupling effect with the DXY US dollar index. The price of Bitcoin has also been declining even as the US dollar has weakened against other currencies. A weakening US Dollar and a declining Bitcoin could signal broader risk aversion or financial stress, even though the dollar is losing strength against other major currencies.
“This might happen when global markets face uncertainty, leading investors to flee from riskier assets like Bitcoin while also moving away from the US dollar.”, says the report.
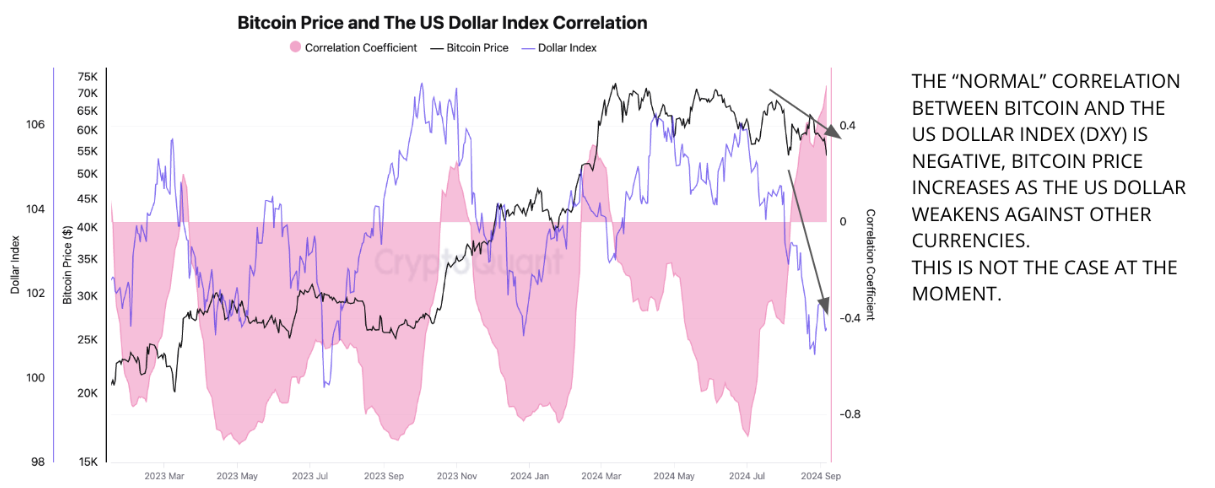
Bitcoin and US Dollar Index Correlation chart
All eyes on the Fed
Next week’s calendar features a key event for markets: the Fed decision over interest rates on Wednesday. An interest-rate cut is fully-price in for markets, but traders are divided over whether the Fed will opt to cut interest rates by 25 basis points or will do it by a larger 50 basis points.
Lower interest rates tend to help risk assets such as cryptocurrencies, so a large cut could be bullish for Bitcoin. The effect of a smaller 25-basis-points cut looks less certain as risk markets could cheer anyway the move or consider it as too timid.
Bitcoin eyes for $60,000 mark
Bitcoin price retested the daily support level around $56,000 on Wednesday and bounced 3.7%. At the time of writing on Friday, it trades at around $58,000.
If the $56,000 level continues to hold as support, BTC could rise from its current trading level to its 50% price retracement level of $59,529 (drawn from a high in late July to a low in early August).
The Moving Average Convergence Divergence (MACD) indicator further supports Bitcoin’s rise as it signals a bullish crossover on the daily chart. The MACD line (blue line) moved above the signal line (yellow line), giving a buy signal. It shows rising green histogram bars above the neutral line zero, also suggesting that Bitcoin’s price could experience upward momentum.
The Relative Strength Index (RSI), meanwhile, hovers broadly unchanged very close to its neutral level, indicating lack of momentum.
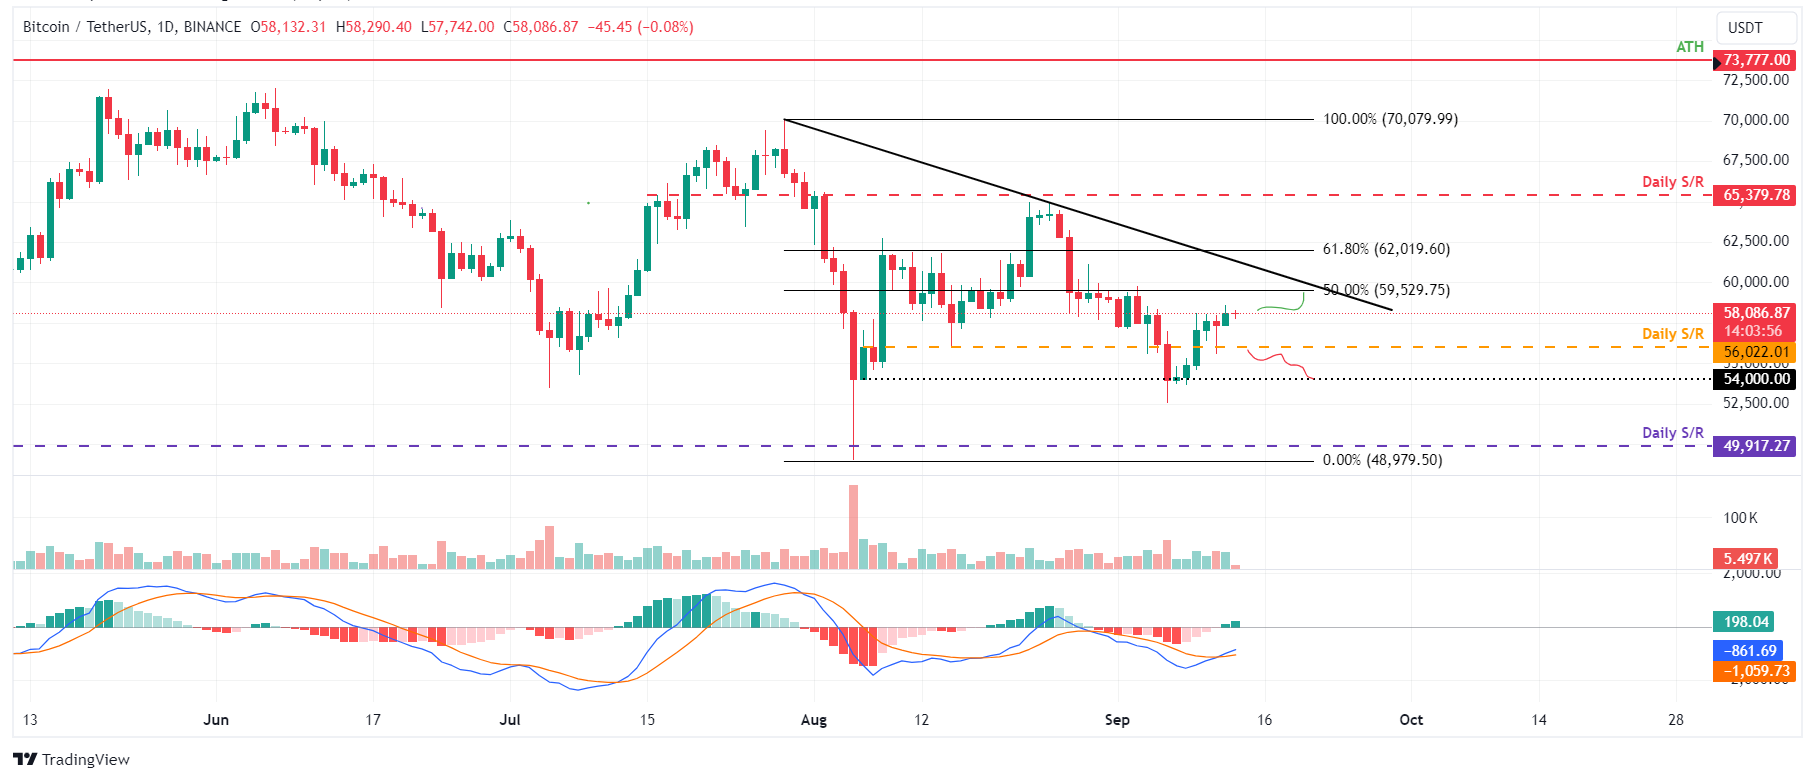
BTC/USDT daily chart
The bullish thesis would be invalidated if Bitcoin’s daily candlestick closes below $56,000. This scenario would lead to a 3.5% decline to retest its psychologically important level at $54,000.
Author

Manish Chhetri
FXStreet
Manish Chhetri is a crypto specialist with over four years of experience in the cryptocurrency industry.


