Top 3 Price Prediction Bitcoin, Ethereum, Ripple: Cryptos hit the breaks while investors make up their mind
- Bitcoin saw a bullish candle on Wednesday but bears still defend the upper side of the pennant.
- Ethereum breaks out of its pennant, but a bull trap appears to be forming as buyers cannot get past intermediary resistance.
- XRP keeps respecting the pennant and looks clueless about where to go next.

Bitcoin price looks to keep respecting the confines of its pennant as global markets are taking a breather after the positive rally on Wednesday. For Ethereum, more worrying price action looks to be unfolding as bulls have twice failed to break above $4,465, and in the process, are forming a bull trap. Meanwhile, XRP looks to be more promising as the upside of the pennant has been tested twice and looks ripe for the breakout.
Bitcoin price sees investors awaiting further data to assess risk mode
Bitcoin (BTC) price popped higher yesterday after positive news on the Omicron virus and the protective factor of current vaccinations. Investors eagerly jumped into riskier assets like stocks and cryptocurrencies on the news. This move pushed the BTC price above $50,000 in a solid bull rally. But the good news looks short-lived as most markets are taking a break this morning and giving up earlier profits.
BTC price is now in decline as bears push price back below $50,000 during European hours. This is creating some nervousness amongst bulls as they risk being stopped out should bears be able to push the price to the downside, in a breakout move from the pennant. $48,760 in particular is critical for bulls as many stops have been placed just below there.
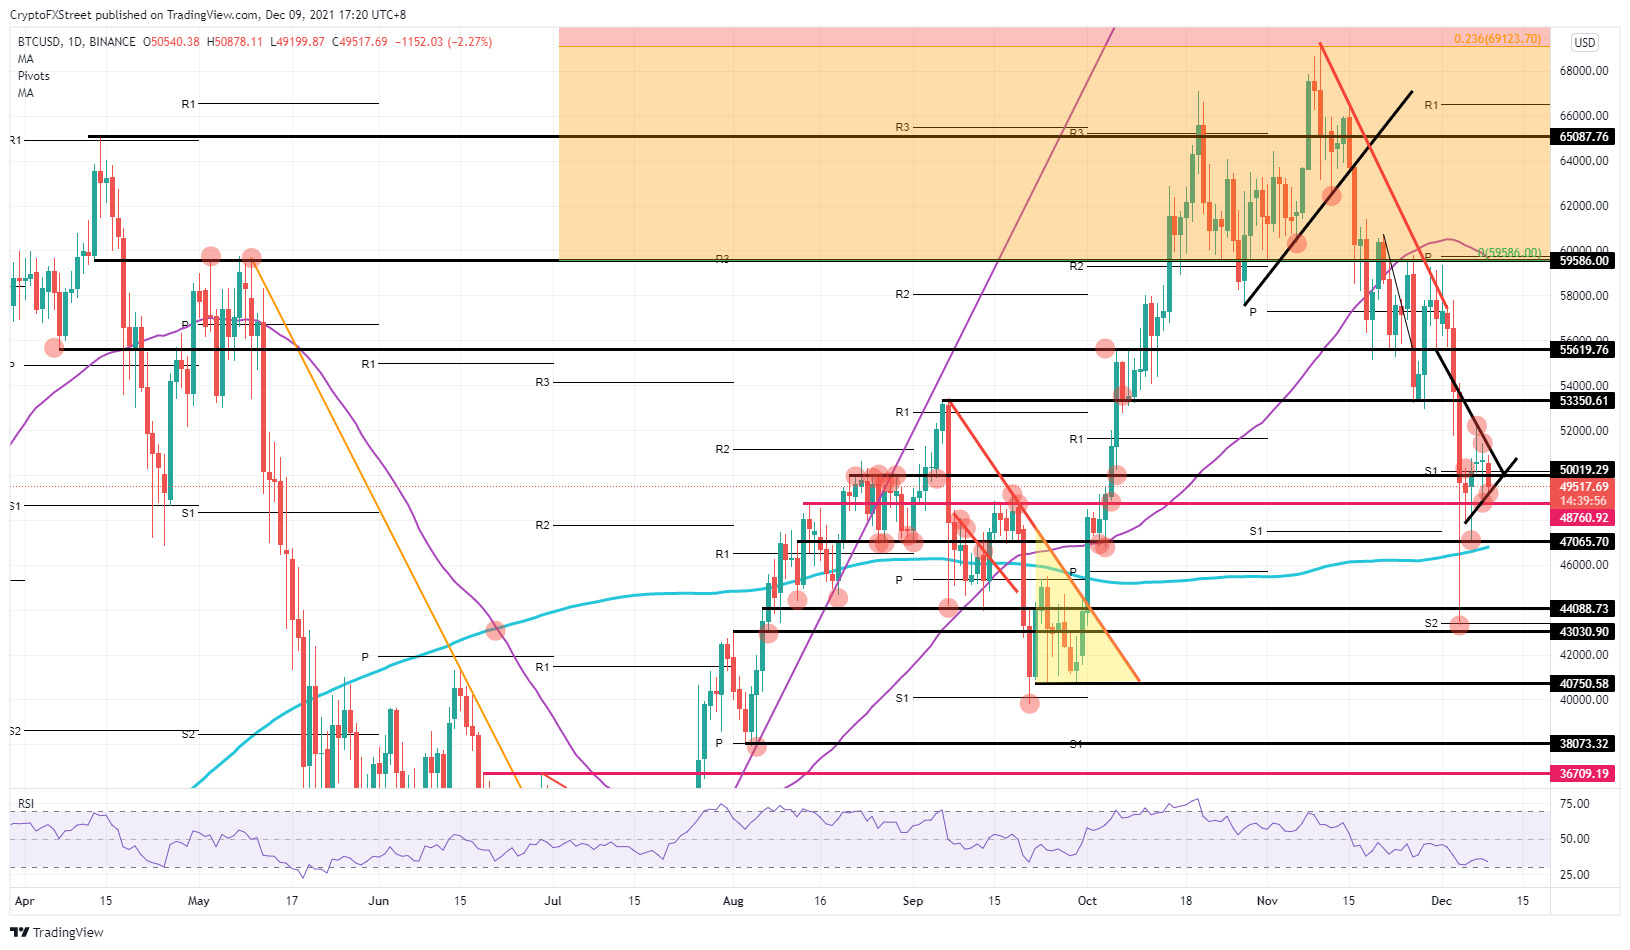
BTC/USD daily chart
Expect some sideways action with $48,760 to hold. Should one or two favorable tailwinds emerge, a breakout to the upside would push BTC price back above $50,000 and lead to a bullish breakout from the pennant, targeting $53,350. If investors start to close out their positions, however, expect a downward spiral to start with a break below $48,760 and a push towards $47,065. That level should hold as support with the 200-day Simple Moving Average providing an additional support factor.
Ethereum price needs bulls to step up their game as a bull trap is looming
Ethereum (ETH) price saw a pennant breakout in favor of bulls, but that is where the positive news ends – at least for now. Bulls quickly hit a hard ceiling at $4,465 and again failed to reclaim this level, as price action got dragged back down. A large part of the bullish reaction is being locked in as profit today, fading the rally from yesterday. For now, the 55-day Simple Moving Average (SMA) at $4,325 is holding, but as no real positive catalyst is presenting itself, it looks as if one negative factor could easily see a break below the 55-day SMA.
ETH price would then fall back into the pennant and keep investors puzzled on what to do next, which would keep ETH trading within a range between $4,060 and $4,465. The bulls have already been rejected twice to the upside, which could spell some further bearish activity and a possible break below $4,060, although the monthly pivot at $4,000 should provide additional support and keep further downside muted.

ETH/USD daily chart
Expect some sideways price action for now as investors assess the new situation and look for further guidance as to whether risk-on or risk-off will predominate during the last few weeks of 2021. Should ETH price break above $4,465 , expect a further uptick as investors seize their cue to go long and quickly drive price higher to $4,646. On the downside, a break below the pivot at $4,000 would see an accelerated move back towards $3,687.
XRP price still caught in pennant despite bullish knee-jerk reaction
Ripple (XRP) price saw bulls bounce off the low end of the pennant and then hit a cap at the high end of the pattern. Bulls look to be staying in their positions as the high of today has already been breached with a breakout of the pennant to the upside. This opens the door for more investors to jump in, emboldened by the determination and conviction of buyers..
A break above $0.88 could see a quick push towards $1.05, piercing the 200-day Simple Moving Average at $0.95 along the way. This element could spark some profit-taking, but all in all, bulls should be able to withstand that and reach $1.05. The speed and velocity of the rise will depend on the presence of tailwinds providing sufficient conviction to remain in the trade.

XRP/USD daily chart
If sentiment rolls over and takes a turn to the downside, expect a break of the lower end of the pennant and a move below $0.84. Once through that, the sell-off will accelerate and see XRP price make a quick push towards $0.62. This area would provide an excellent entry for a fade-in with the monthly S2 support level at $0.58, giving a $0.04 window of entries at a lucrative discount.
Author

Filip Lagaart
FXStreet
Filip Lagaart is a former sales/trader with over 15 years of financial markets expertise under its belt.