Top 3 Price Prediction Bitcoin, Ethereum, Ripple: XRP comes to a standstill while BTC and ETH are getting started
- Bitcoin price hints that a new all-time high is approaching fast.
- Ethereum coils up in an inverse head-and-shoulders pattern, eyeing $2,400.
- Ripple bulls fall short of momentum before hitting a 49% upswing target at $1.5

The cryptocurrency market seems tightly wound, especially the altcoins, whose funding rates show a massive spike of late. Such a condition reveals that the speculators are betting on an upward move in asset prices.
The funding rates for BTC and ETH are relatively lower than that of XRP or other cryptocurrencies. This contrast suggests that it is expensive to go long on Ripple due to an overwhelming number of investors hoping to ride the bull wave.
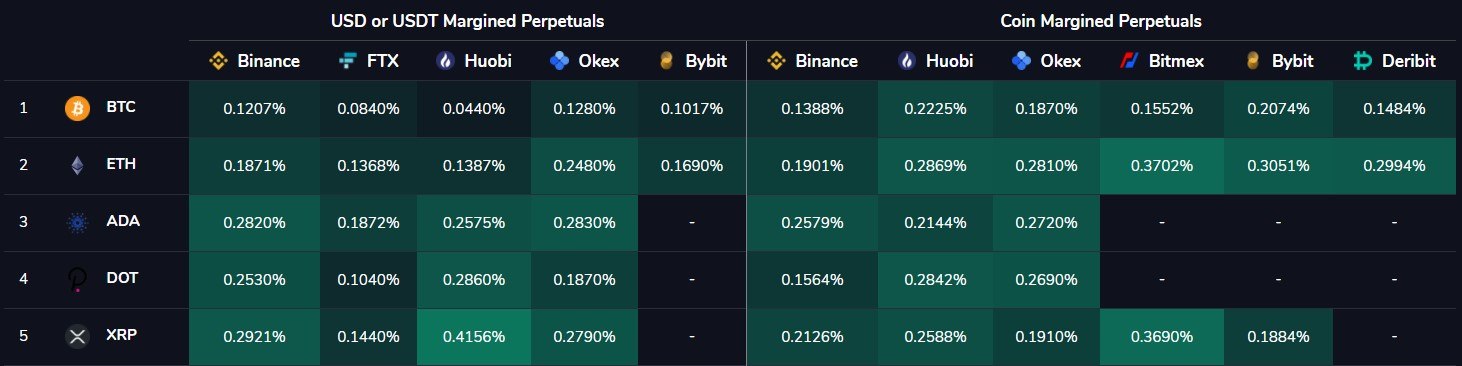
Bitcoin, Ethereum, XRP Funding rates chart
A volatile move in Bitcoin, hopefully toward the upside, might cause a migration of market participants toward the pioneer cryptocurrency. If this were to happen, a crash in the overleveraged altcoin sector seems likely.
Bitcoin bulls patiently wait for the next leg-up
Bitcoin price approaches the recently set up all-time high at $61,781.83, as it consolidates inside an ascending parallel channel.
This pattern is formed when BTC’s higher highs and higher lows are connected using trend lines.
BTC has surged nearly 22% since tapping the lower boundary on March 25. If the bullish momentum pushes the flagship cryptocurrency beyond the all-time high, a 10% ascent toward the channel’s middle line at $68,127 seems likely.
The buyers could gather steam around the $65,184 level before hitting the target mentioned above.
Such a move would erect new all-time highs. Moreover, if the buyers FOMO into the BTC markets, that would create a bullish scenario where the Bitcoin price could further rise another 10% to $75,291, which coincides with the 141.4% Fibonacci extension level.
Supporting this upswing is the SuperTrend indicator’s buy signal, which has flashed after nearly a month.
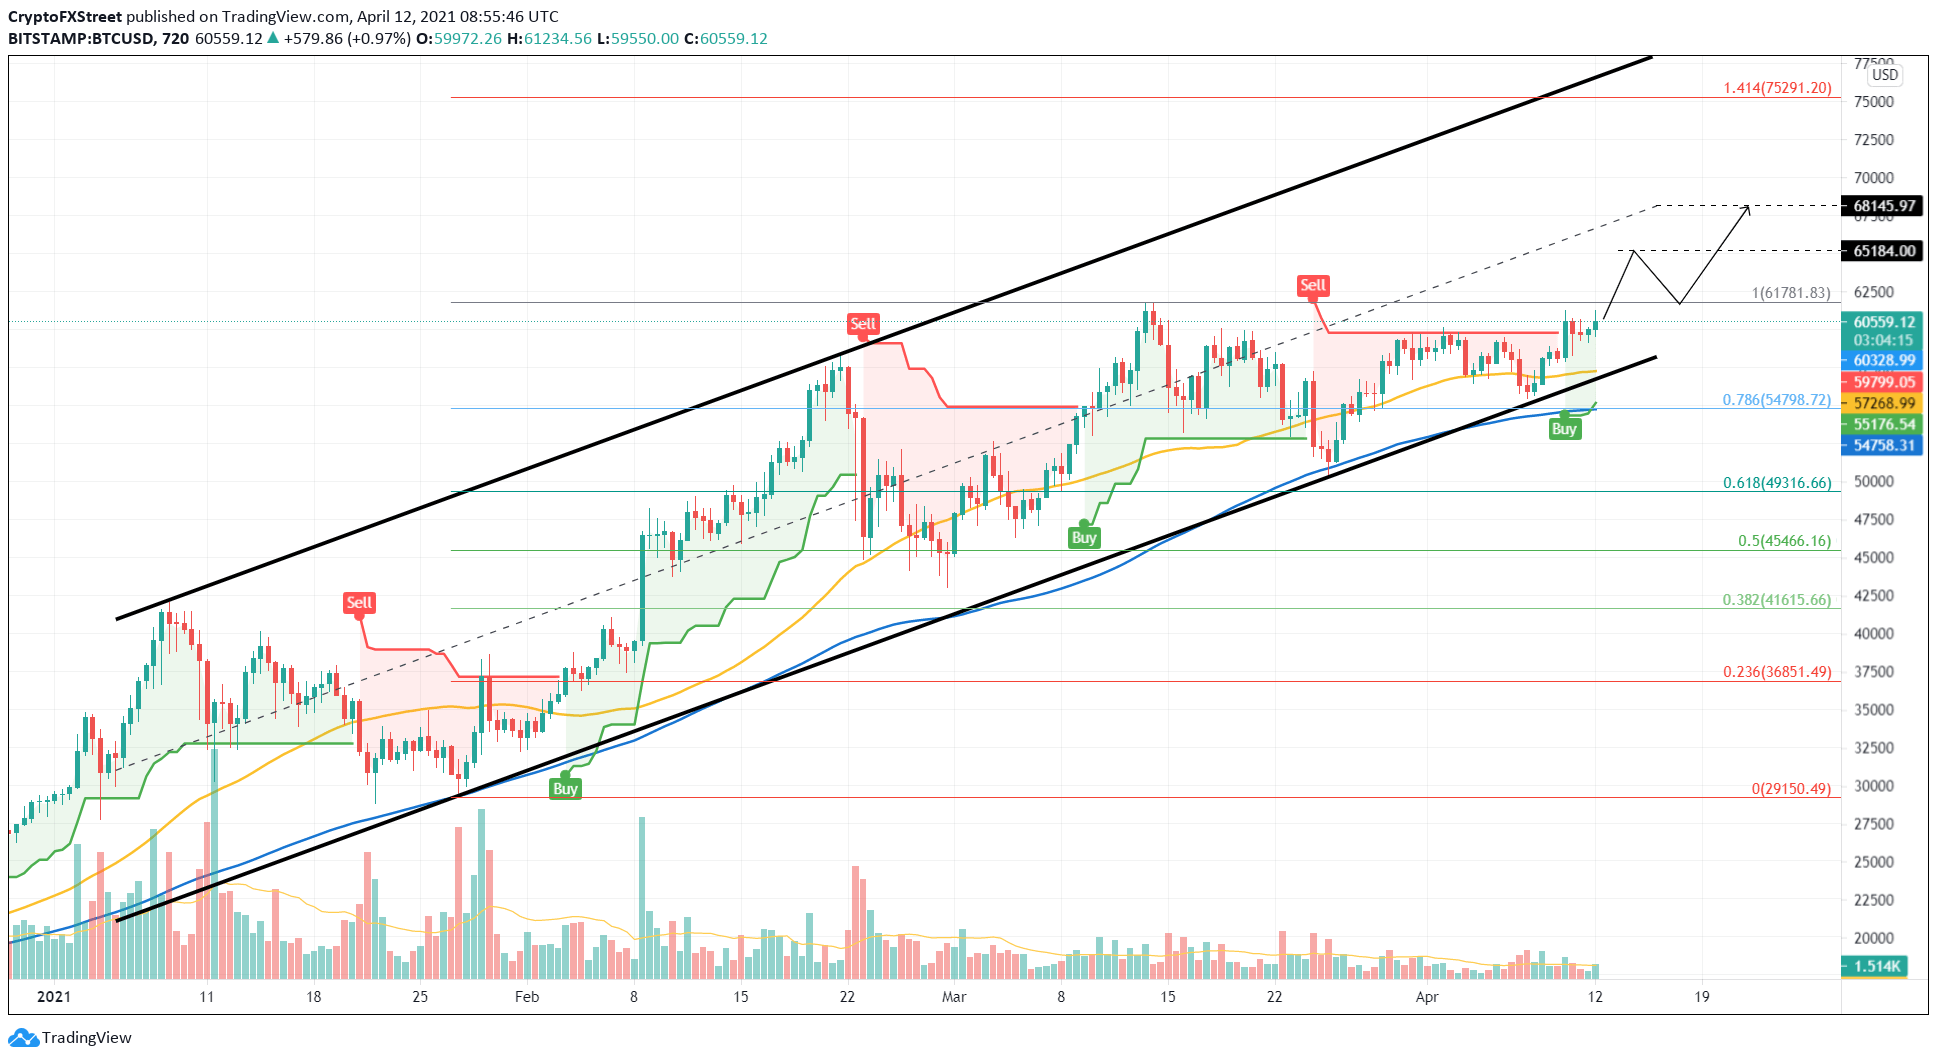
BTC/USD 12-hour chart
While the outlook seems bullish for Bitcoin, a failure to surge past its all-time high could deter investors from taking up long positions. If sellers begin to overwhelm the buying pressure, a retest of the 50 Simple Moving Average on the 12-hour chart at $57,288 is likely.
A breakdown of this level could slide the Bitcoin price to the 78.6% Fibonacci retracement level at $54,798.
Ethereum on track to $2,546
Ethereum price shows the formation of a symmetrical triangle pattern, which is obtained by connecting the series of lower highs and higher lows set up since February 20. This technical formation forecasts a 36% upswing upon the breach of the setup’s upper trend line at $1,860. The target at $2,546 is determined by adding the distance between the triangle’s first pivot high and low, to the breakout point at $1,860.
The smart-contract token sliced through this trend line on March 31, signaling a breakout and kick-starting the rally to record levels.
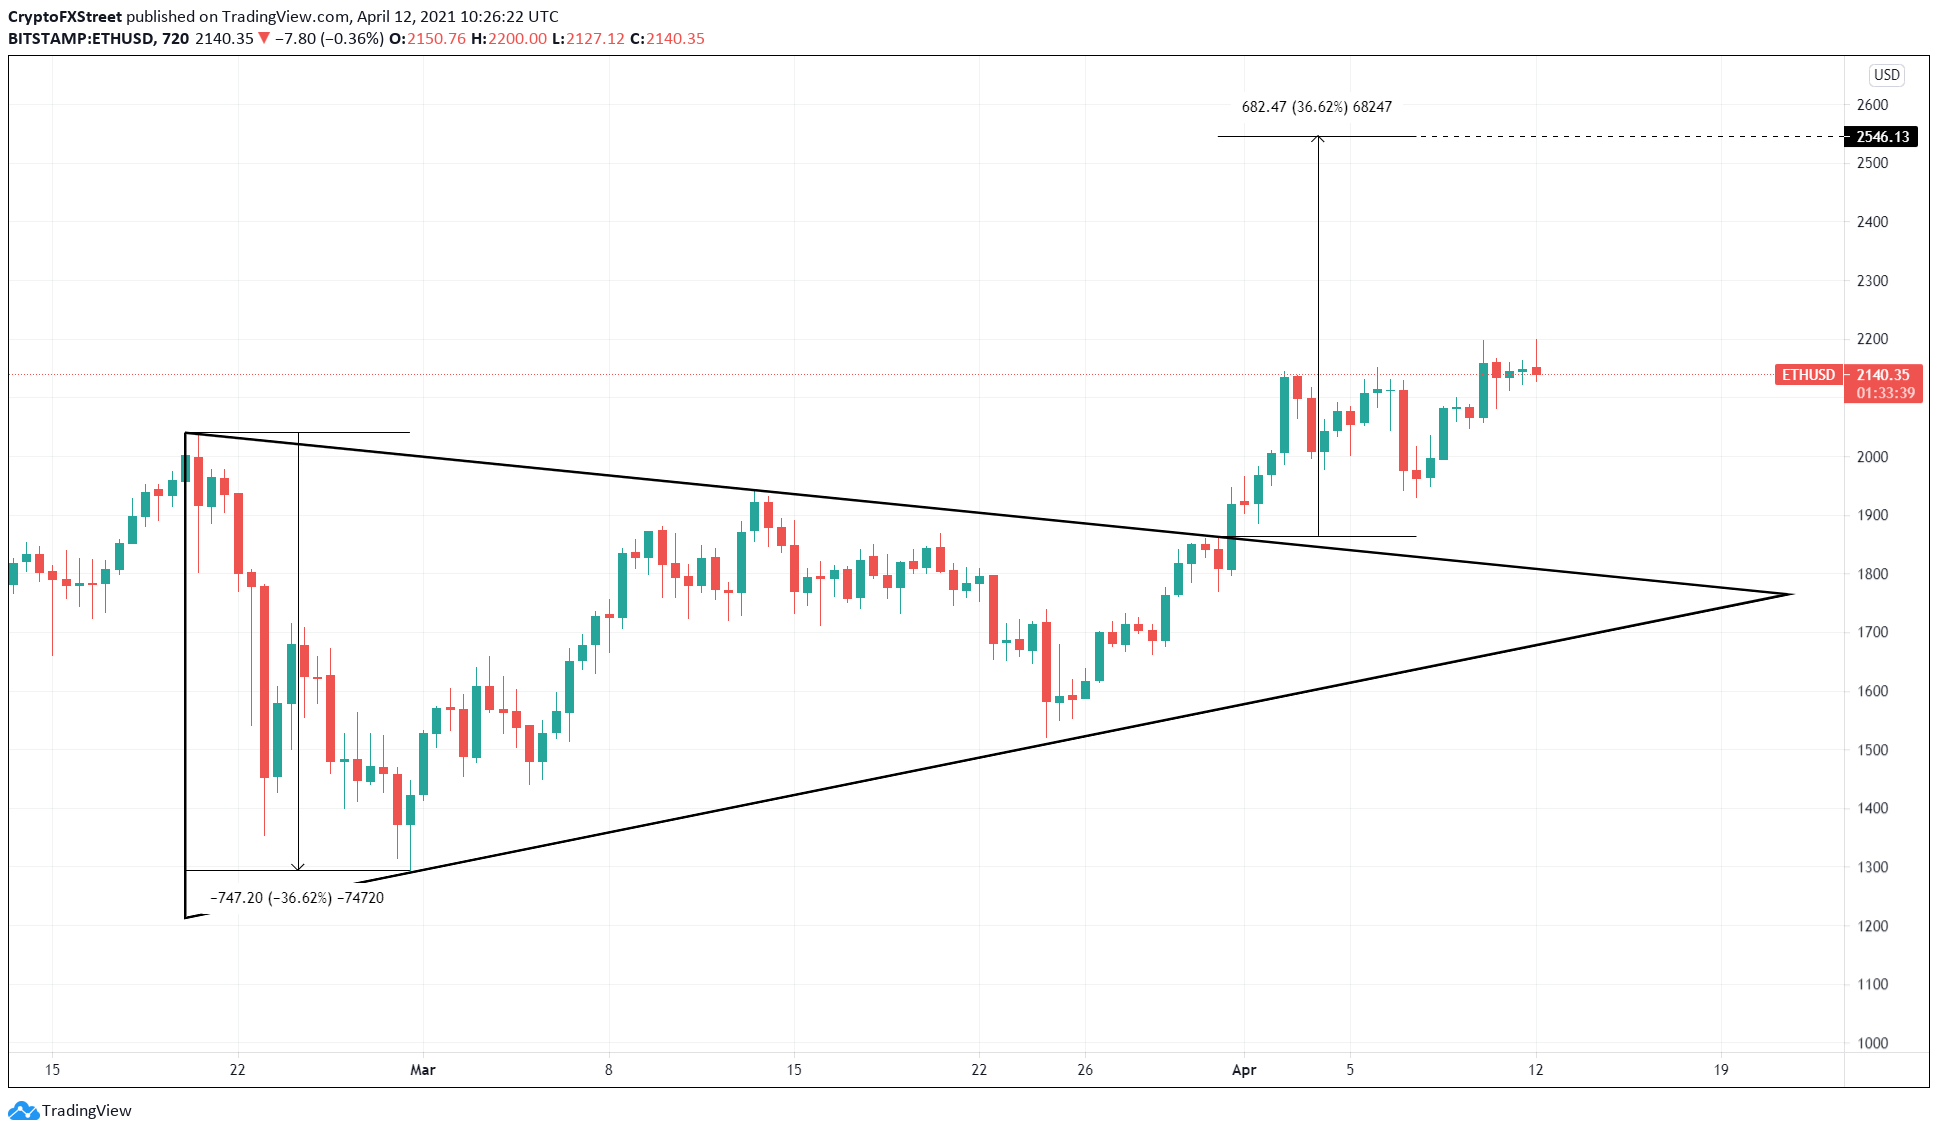
ETH/USD 12-hour chart
While the neckline’s breakdown is credible, a potential spike in selling pressure that pushes ETH below there could hamper the optimistic outlook.
If Ethereum price falls below the Momentum Reversal Indicator’s breakout line at $2,137 for an extended period, the bullish thesis could face invalidation. In such a scenario, the pioneer altcoin would slide toward the subsequent breakout line at $2,078.
Ripple buyers fall short
XRP price has been on a tear since it confirmed a breakout from the inverse head-and-shoulder pattern on April 5. Since then, the remittance token has surged nearly 135% in under a week.
The recent run-up was a breakout from the bullish pennant pattern, which contains a sharp spike in price, known as a flag pole, followed by a consolidation in the form of a symmetrical triangle pattern, referred to as the pennant.
A breakout from the setup’s upper trend line forecasts a 49% upswing to $1.56, which is obtained by adding the flag pole’s height to the breakout point at $1.04.
Since XRP’s breach above the pennant on April 10, the price has surged nearly 42% to $1.48. While extending the rally by just another 4.51% would have sealed the deal, the buyers seem to have lost steam as the market value shows a 7% decline since hitting the yearly highs at $1.48.
A continuation of this bearish correction could push the remittance token price to $1.29, which coincides with the 78.6% Fibonacci retracement level. A potential spike in selling pressure that leads to a breakdown of this demand barrier could trigger a 12% correction to $1.40.
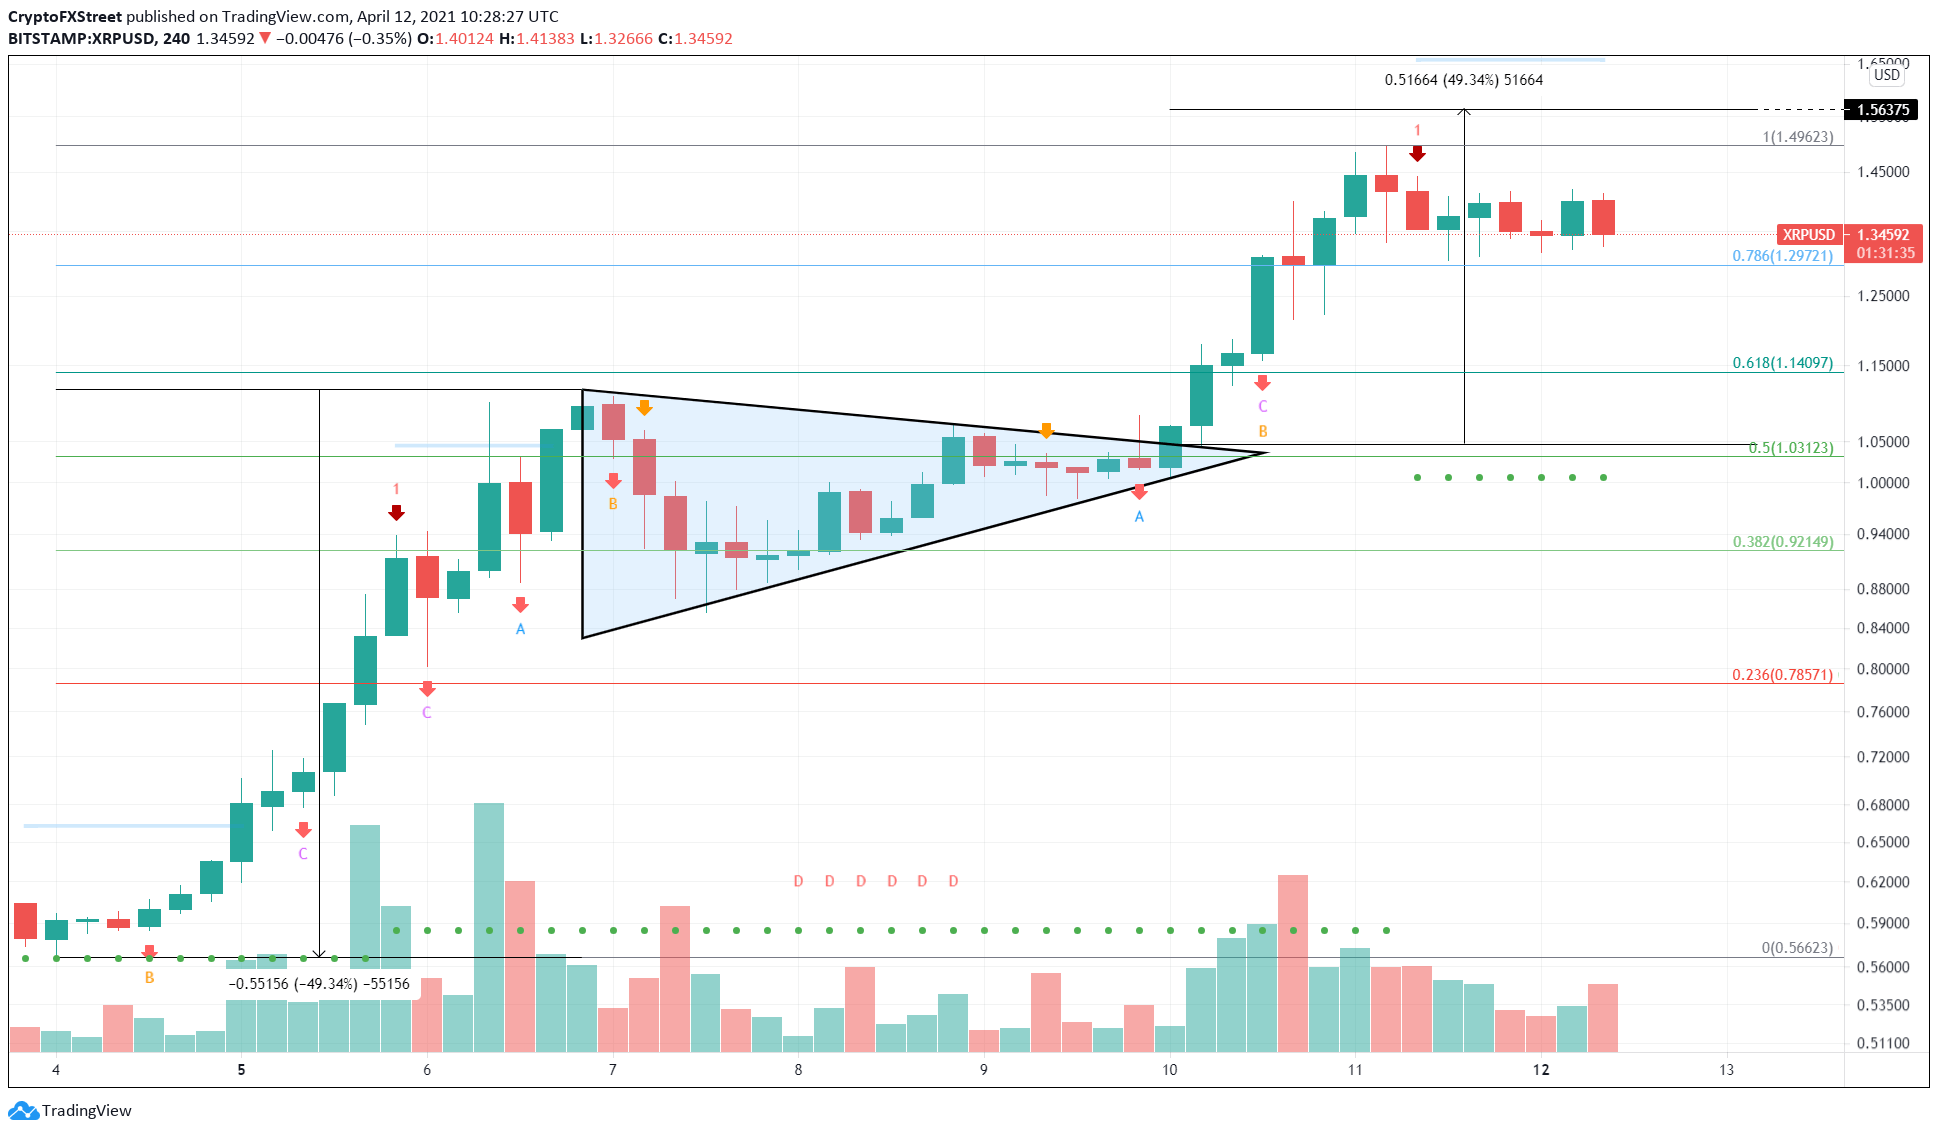
XRP/USD 4-hour chart
On the flip side, if the buyers make a comeback, the XRP price might tap the target at $1.56. If the bullish momentum persists, it might catapult Ripple by 16% toward the 127.2% Fibonacci extension level at $1.74.
Author

Akash Girimath
FXStreet
Akash Girimath is a Mechanical Engineer interested in the chaos of the financial markets. Trying to make sense of this convoluted yet fascinating space, he switched his engineering job to become a crypto reporter and analyst.


