Ethereum price preparing for an assault on the measured move target of $2,559
- Ethereum price potential induces new miners to join the highly competitive space.
- ETH is dominating platforms like YouTube.
- Hyped 2.0 upgrade will energize the development of apps that “dwarf” bitcoin.

Ethereum price is tightly consolidating the breakout from a symmetrical triangle pattern on March 31. The pause does not negate the bullish outlook for the smart contract giant moving forward. Traders need to be patient and mindful that a deeper throwback could still occur before resuming the new rally.
Ethereum price highs have a narrow base of support
A recent study by Total Processing revealed that ETH was the most popular cryptocurrency on YouTube, with 231 million views to date. Bitcoin’s views are 200 million. Clearly, media does play a substantive role in the popularity of cryptocurrencies, but YouTube’s role is just as significant.
ETH hash rate has reached new highs along with price, demonstrating that more resources are being devoted to process transactions on the blockchain, making the network more resilient to attacks. More specifically, the rising hash rate reveals that new miners are joining the highly competitive space because of Ethereum’s high price potential.
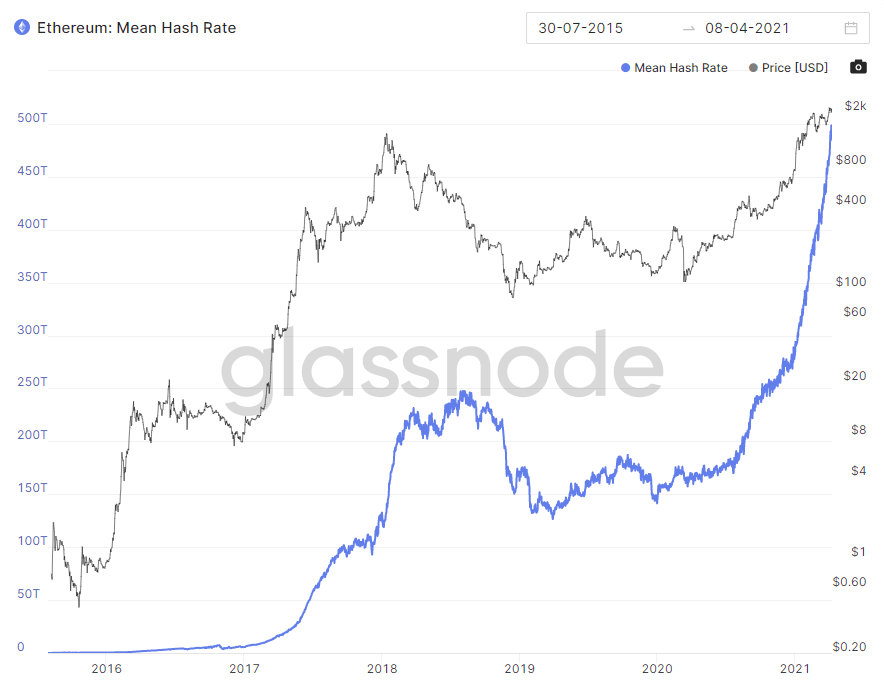
Source: Glassnode
In contrast, the momentum in ETH is being questioned by on-chain analysis that projects that the token is at risk of a deep pullback in the foreseeable future. According to Chainalysis, the advance to new highs has a narrow support base. The first observable demand for Ethereum emerges at $1,800, and support at $1,500 is “particularly strong, with 33.3M ETH acquired above this level at a total cost of $58 billion.”
Nonetheless, the symmetrical triangle measured move target is $2,559.25, and it remains the best-case scenario for ETH in the short term. Earlier resistance will emerge at the 138.2% and 161.8% Fibonacci extension levels of the February decline at $2,327 and $2,504, respectively.
In the medium-term, traders should not overlook the 261.8% extension level of $3,253.
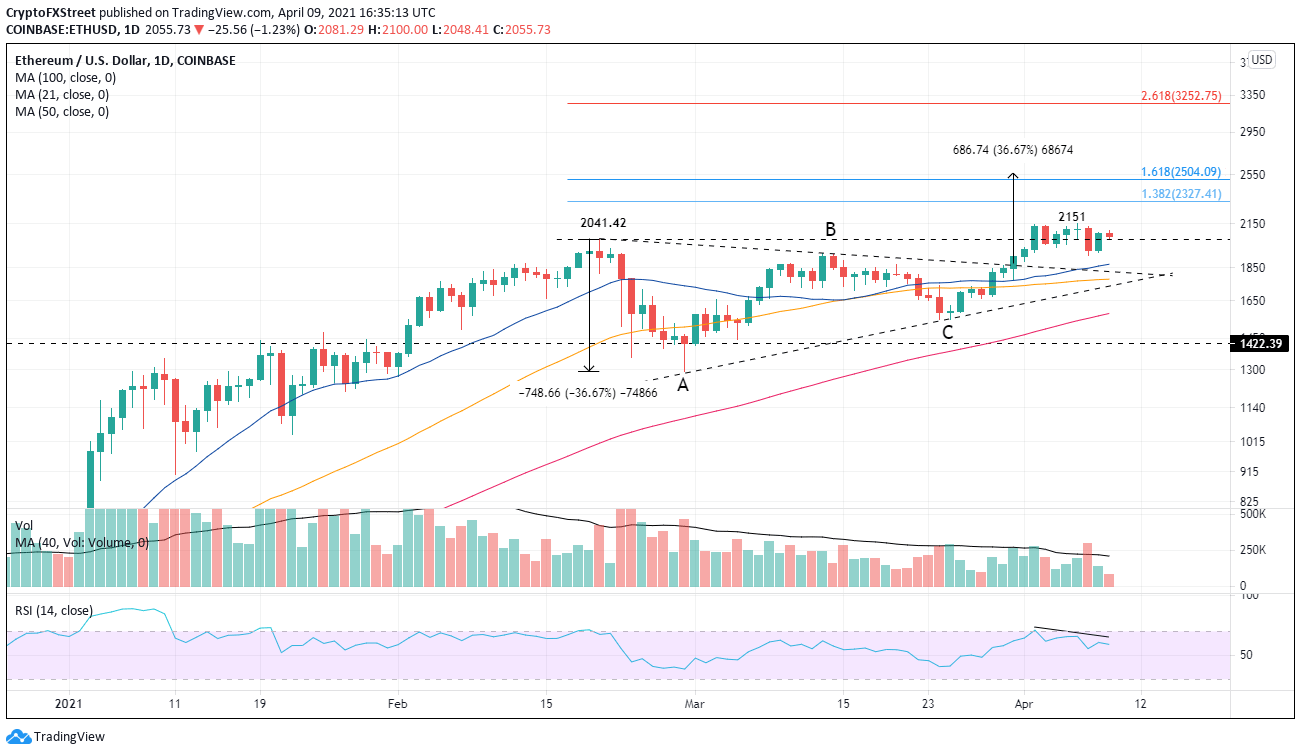
ETH/USD daily chart
Traders should be alert to the bearish momentum divergence at the $2,151 high and the weak volume accompanying the triangle breakout. To be prepared, mark the 21-day and 50-day simple moving averages (SMA) at $1,871 and $1,777, respectively, as initial support.
More significant declines will target the 100-day SMA at $1,579 and the March low at $1,546.
Author

Sheldon McIntyre, CMT
Independent Analyst
Sheldon has 24 years of investment experience holding various positions in companies based in the United States and Chile. His core competencies include BRIC and G-10 equity markets, swing and position trading and technical analysis.


