Top 3 Price Prediction Bitcoin, Ethereum, Ripple: It’s all about the round numbers
- Bitcoin price tone remains undecided in the short term.
- Ethereum price readying for an assault on the measured move target of $2,559.
- XRP price completed two inside days around $1.00.

One of the main obstacles for the average investor to using cryptocurrencies is their excessive volatility. Identifying quality opportunities requires detailed, adapted technical analysis and proven rules, albeit not complex, to speculate successfully. In the case of Bitcoin, Ethereum, and Ripple, the current daily charts offer some similarities and some differences that will require patience and adaptability.
Bitcoin price languishing below $60,000
BTC price structure shows two alternatives for traders moving forward. It could construct an ascending wedge pattern by making another marginal high accompanied by a bearish momentum divergence before declining. Or, it could complete a head-and-shoulders top pattern now and immediately fall to a level that would bring an oversold condition on the daily Relative Strength Index (RSI).
Based on alternative one, BTC will quietly rally through the 361.8% Fibonacci extension of the 2017-2018 bear market and to the upper trendline at $69,945 before a sharp reversal. The reversal should not discover support until the lower trendline at 55,535, which aligns closely with the 50-day simple moving average (SMA) at $54,604.
Traders should anticipate some support at $50,305, but the 100-day SMA at $46,267 will attract institutional investors. Additional support is the February low at $43,016.
In the case of alternative two, it will be a quick break of the neckline at $55,535 and the 50-day SMA. As in alternative one, there will be support at $50,305, the 100-day SMA, and $43,106 along the way, but the measured move target is lower at $42,040.
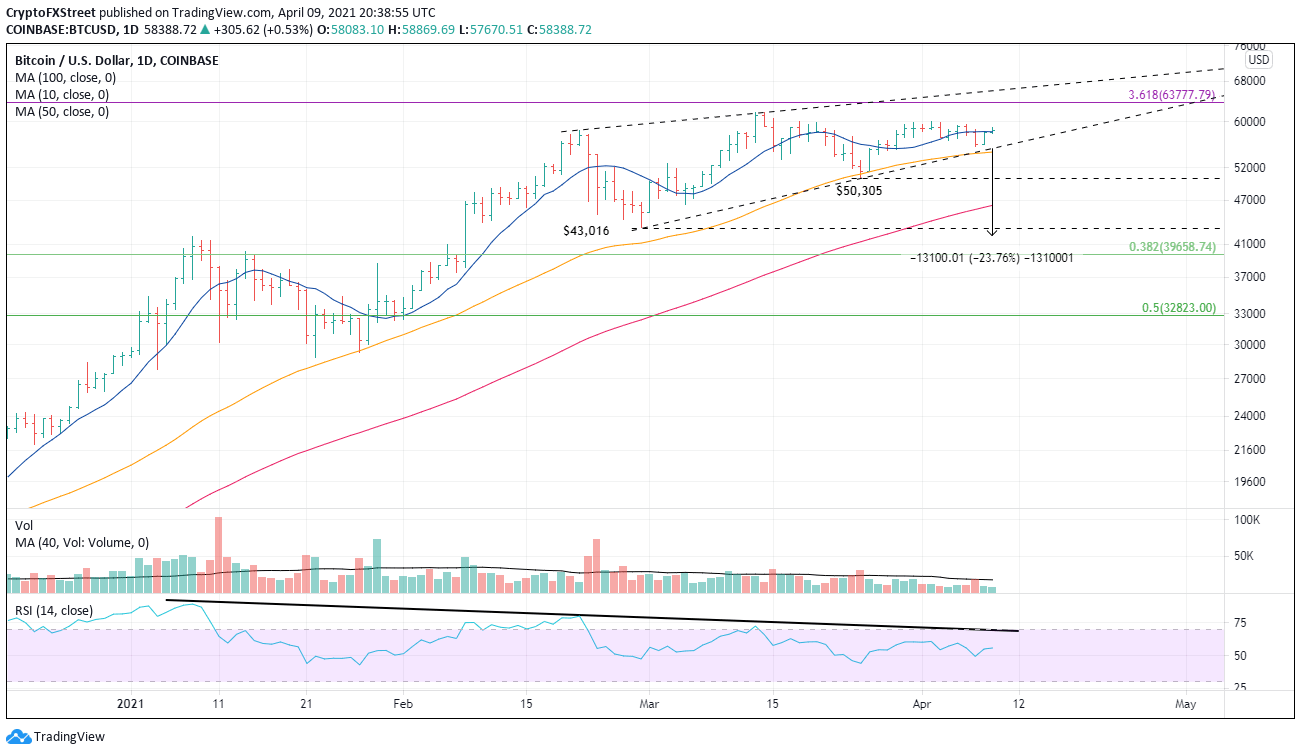
BTC/USD daily chart
To invalidate the bearish scenarios, BTC will have to close above the upper trend line at $66,040 on a daily basis.
Ethereum price oscillates near $2,000
ETH has not generated serious momentum off the breakout from a symmetrical triangle pattern on March 31, but the multi-day pause does not negate the bullish longer-term outlook for the smart contract giant.
The measured move target of the triangle is $2,599, and it remains the best-case scenario for ETH moving forward. Resistance will appear earlier at the 138.2% and 161.8% Fibonacci extension levels of the February decline at $2,327 and $2,504, respectively. There is an outside chance that the token will reach the 261.8% extension level at $3,253.
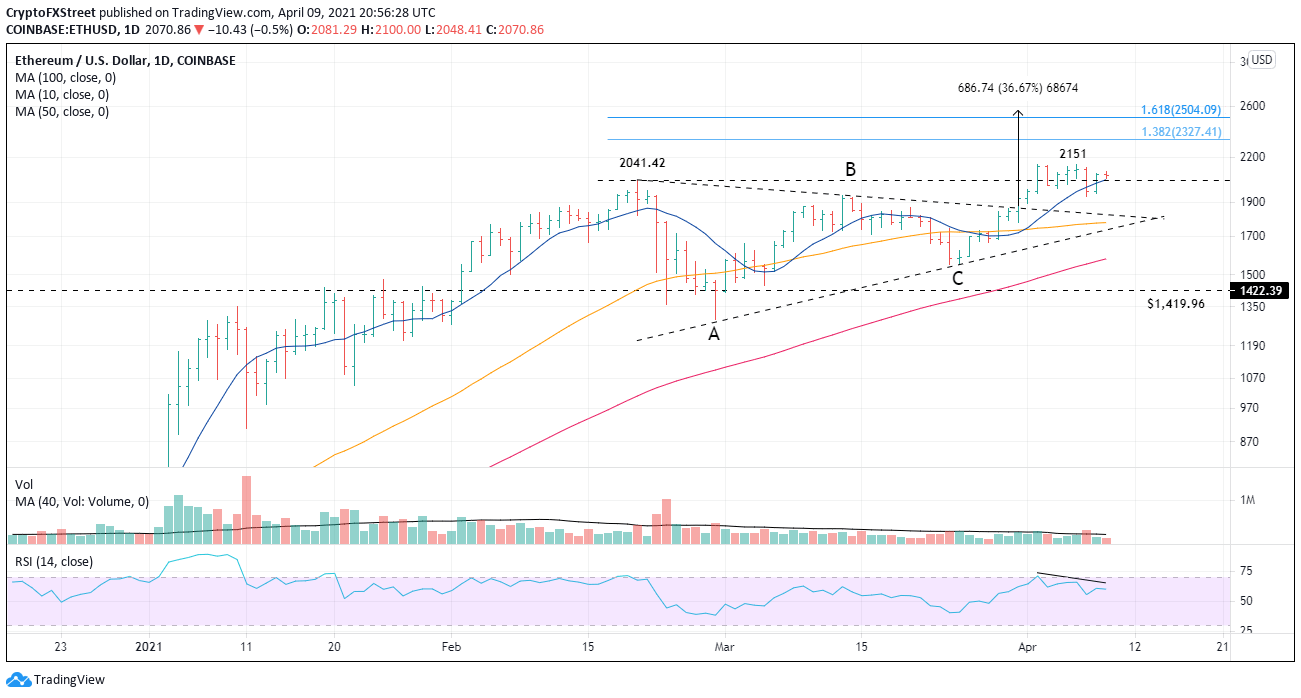
ETH/USD daily chart
Mark the 21-day and 50-day SMAs at $1,871 and $1,777, respectively, as support. If a more significant decline unfolds, traders need to watch the 100-day SMA at $1,579 and the March low at $1,546. And, don’t overlook the 2018 high at $1,419.96 as a support level.
XRP price magnet around $1.00
This week’s massive rally for Ripple has successfully lifted the international settlements token through the difficult resistance between $0.60 and $0.80, the 23.6 extension level of the 2018-2020 bear market, and the psychological $1.00.
Currently, XRP may be shaping a pennant continuation pattern around $1.00 after closing Wednesday and Thursday with inside days. Ideally, the pattern should take a couple more days, but the loosening of the SEC case around the neck of Ripple combined with the steady international growth outside the United States may be enough to restart the rally immediately.
As a result, Traders should prepare for resistance at the 38.2% retracement level at $1.33, and if the rally continues with the same momentum as this week, the 50% retracement level at $1.70
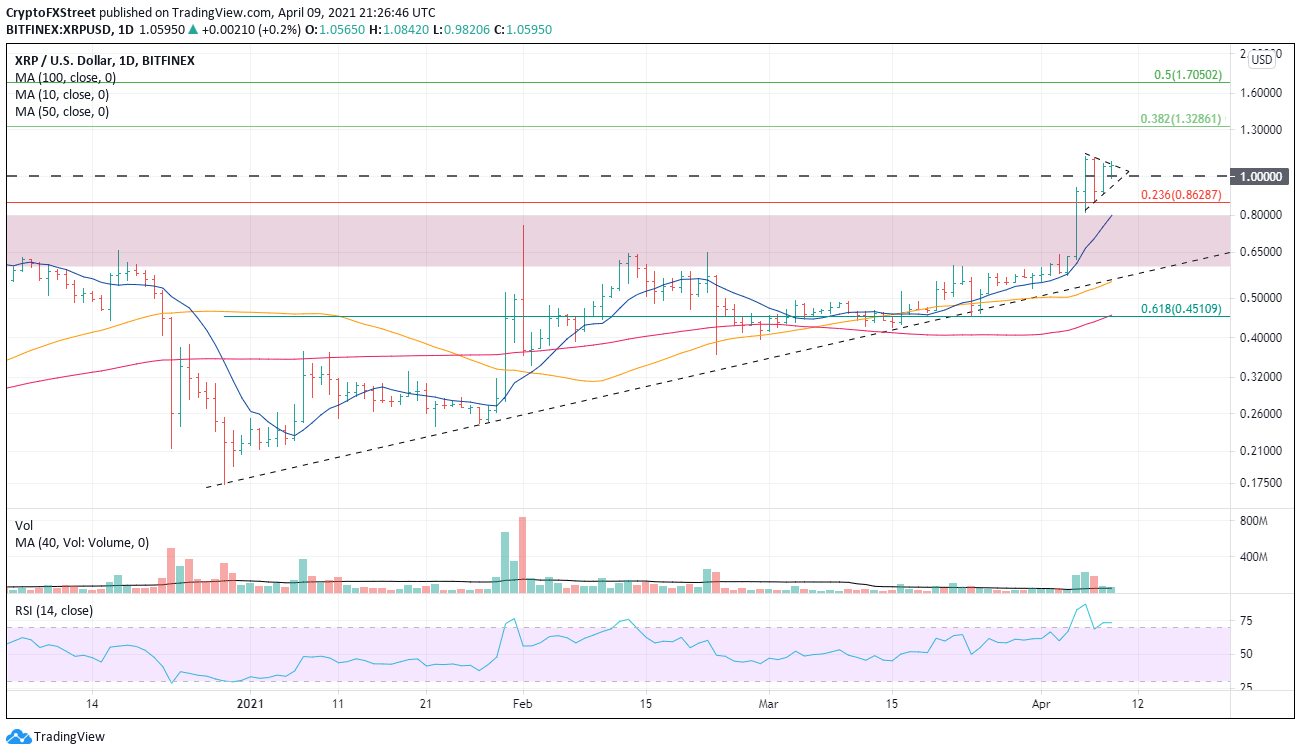
XRP/USD daily chart
If the SEC case turns sour and XRP plunges back into the $0.60-$0.80 range, all bets are off for the digital token, and traders should revert to trading the range.
Author

Sheldon McIntyre, CMT
Independent Analyst
Sheldon has 24 years of investment experience holding various positions in companies based in the United States and Chile. His core competencies include BRIC and G-10 equity markets, swing and position trading and technical analysis.


