Ethereum Price Forecast: ETH pattern projects an additional 20% upside
- Ethereum price supported by speculators looking for a run similar to 2017.
- IOMAP data shows exceptional support near previous high.
- Bullish reversal from below $2,041.42 shows demand on pullbacks.

Ethereum price registered an explosive breakout last week from a symmetrical triangle pattern that has continued this week but on weak volume. The ETH outlook remains positive in the short term, with a measured move target of $2,507.60.
Ethereum price sees big things coming in the future.
Yesterday, with some fanfare, ETH touched a new all-time high at $2,195, triggering a broader acceleration in gains across the cryptocurrency complex. It comes less than a week after the smart contracts giant broke its previous high of $2,041.42.
This week’s bullish reversal from below $2,041.42 reset the currency for further gains moving forward. Interestingly, the reversal bottomed at the 138.2% Fibonacci extension of the 2018 bear market, a level that was resistance three of the previous six weeks.
The IntoTheBlock In/Out of the Money Around Price (IOMAP) data indicates no resistance above due to the vicinity of new highs. Still, speculators should count on solid support between $2,044.61 and $2,074.48, where 371.4k addresses purchased over 12 million ETH.
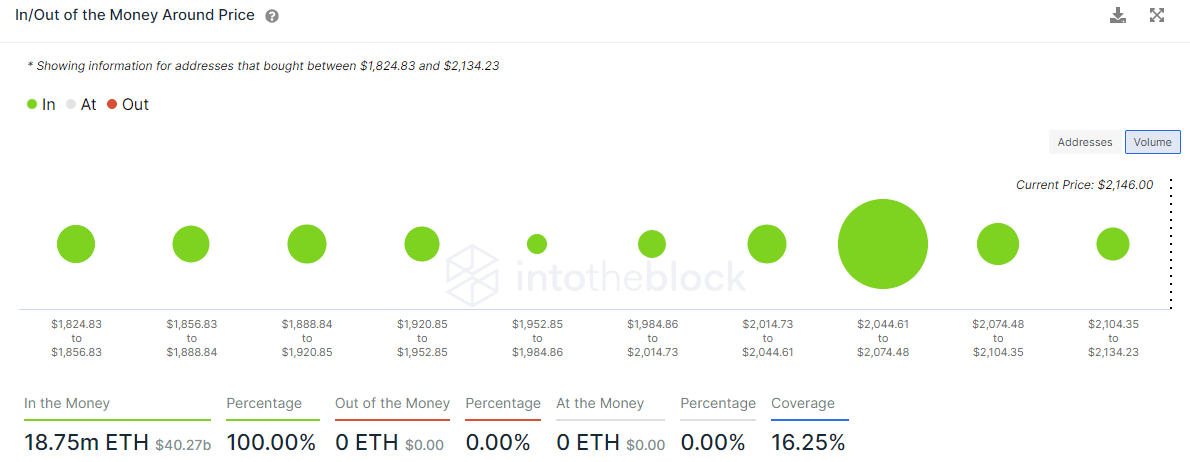
ETH IOMAP chart
The current outlook sees a continuation of ETH strength to the symmetrical triangle’s measured move target at $2,507, an almost 20% gain from the current price. Some resistance may materialize at the 161.8% extension of the 2018 bear market at $2,248 and the 138.2 extension of the February correction at $2,327.
The 161.8% extension of the February correction at $2,504 aligns with the measured move target of $2,507, and it should be a stressful breakthrough for bullish speculators. If heavy buying emerges, speculators should consider the 261.8% extension level at $3,253 as a possible outcome for ETH.
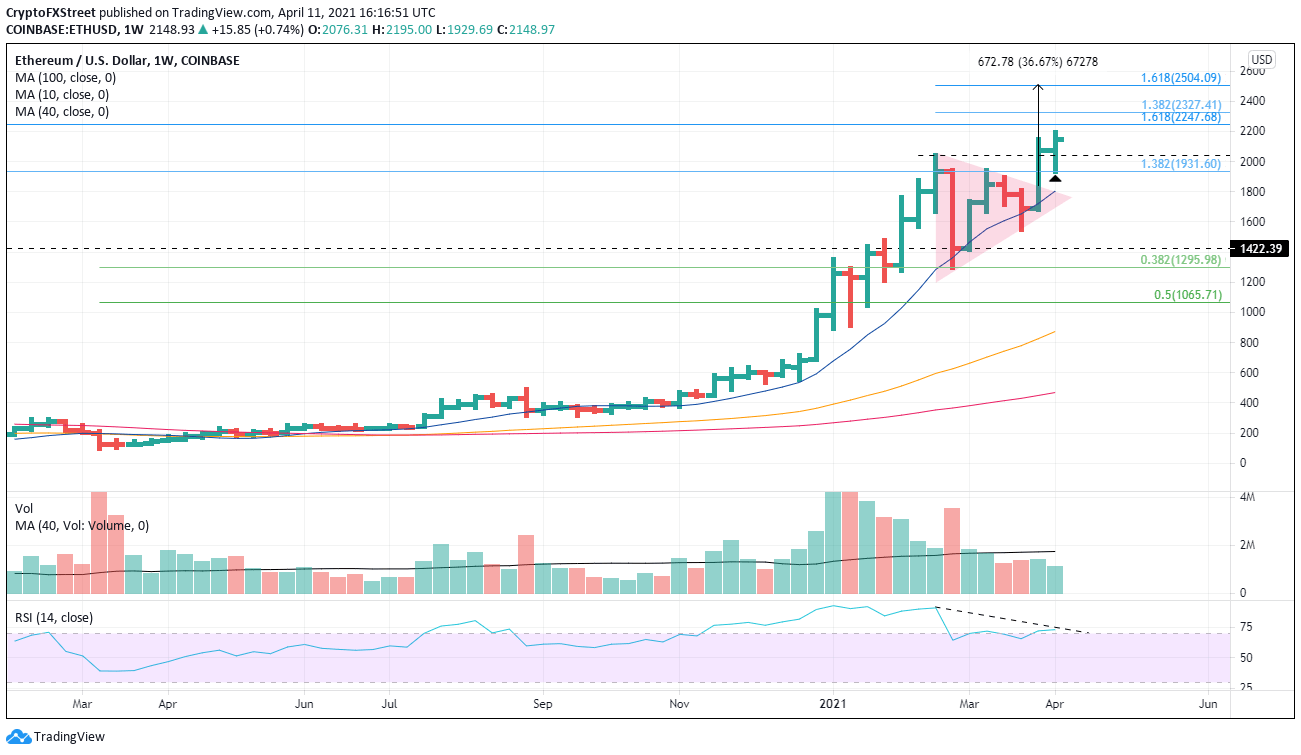
ETH/USD weekly chart
Lingering over the next rush to new highs is the absence of heavy volume. Last week and this week, volume figures are below average, and it could be an impediment for ETH to reach the current outlook objective.
Downside support begins at the 10-week simple moving average at $1,805, followed by the 2018 high at $1,419.96.
Author

Sheldon McIntyre, CMT
Independent Analyst
Sheldon has 24 years of investment experience holding various positions in companies based in the United States and Chile. His core competencies include BRIC and G-10 equity markets, swing and position trading and technical analysis.


