Stellar Lumens Price Prediction: XLM’s two-month-long consolidation reaches tipping point
- Stellar looks forward to a breakout as the Fibonacci index presents possible inflection points.
- A breakout above the 38.2% Fibonacci retracement level could result in an upswing to $0.12.

Stellar lost a significant chunk of its August peak at $0.12 before establishing primary support at $0.067. Recovery from the anchor has not been ballistic but gradual. On the other hand, the upside has been capped under the 200 Simple Moving Average on the 12-hour chart. Consolidation continues to dominate the market, but selected technical indexes hint at a possible breakout with the price hitting the tipping point.
Stellar consolidation approaches an ultimate end
Meanwhile, the $1.6 billion digital asset is changing hands at $0.08. In the last 24 hours, XLM has attracted $139 million in trading volume. Little progress can be reported as the price has been stuck in consolidation for several weeks. The Relative Strength Index gives credibility to the sideways price action as it levels at the midline.
The 50 SMA caps stellar’s immediate upside. The price action above this moving average is likely to retest the next hurdle at $0.085. Further, gains will depend on Stellar’s ability to sustain price action above the 200 SMA.
 (5)-637407631088620785.png)
XLM/USD 12-hour chart
The Fibonacci retracement levels on the 3-day chart, accounting for the last swing high of $0.119 and a swing low of $0.026, confirms that XLM is drawing closer to the tipping point. For now, consolidation is still taking place between the 38.2% and the 50% Fibs. Trading above the upper limit of the range (38.2% Fibo) might result in a great liftoff to the peak in August.
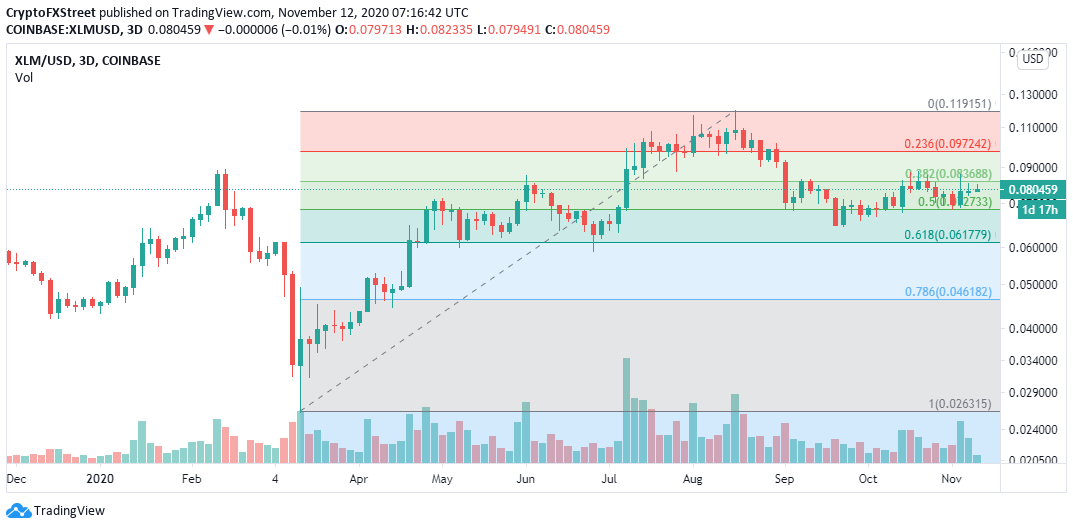
XLM/USD 3-day chart
On the downside, selling activity would be triggered if the price tumbled beneath the 50% Fibonacci. The bearish leg is likely to extend to the tentative support at $0.06, as highlighted by the 61.8% Fibonacci. If massive declines come into the picture, Stellar could shoot downwards, eyeing $0.05.
Author

John Isige
FXStreet
John Isige is a seasoned cryptocurrency journalist and markets analyst committed to delivering high-quality, actionable insights tailored to traders, investors, and crypto enthusiasts. He enjoys deep dives into emerging Web3 tren


