Stellar Price Prediction: XLM may face a pullback despite ongoing bullish breakout
- XLM is currently trading at $0.086 after a 7% price surge in the past 24 hours.
- The digital asset is facing a healthy resistance level to the upside.

Stellar was trading as high as $0.80, with a $14 billion market capitalization at its peak. The digital asset has been trading inside a massive downtrend since January 2018, still trying to recover, exchanging hands at $0.085 per coin.
XLM faces critical resistance ahead
Although the momentum has greatly shifted in favor of the bulls, XLM is still facing a critical resistance on the way to $0.10. The entire crypto market flipped bullishly in the past 48 hours, with Bitcoin cracking $13,000 and ETH $400.
XLM/USD 4-hour chart
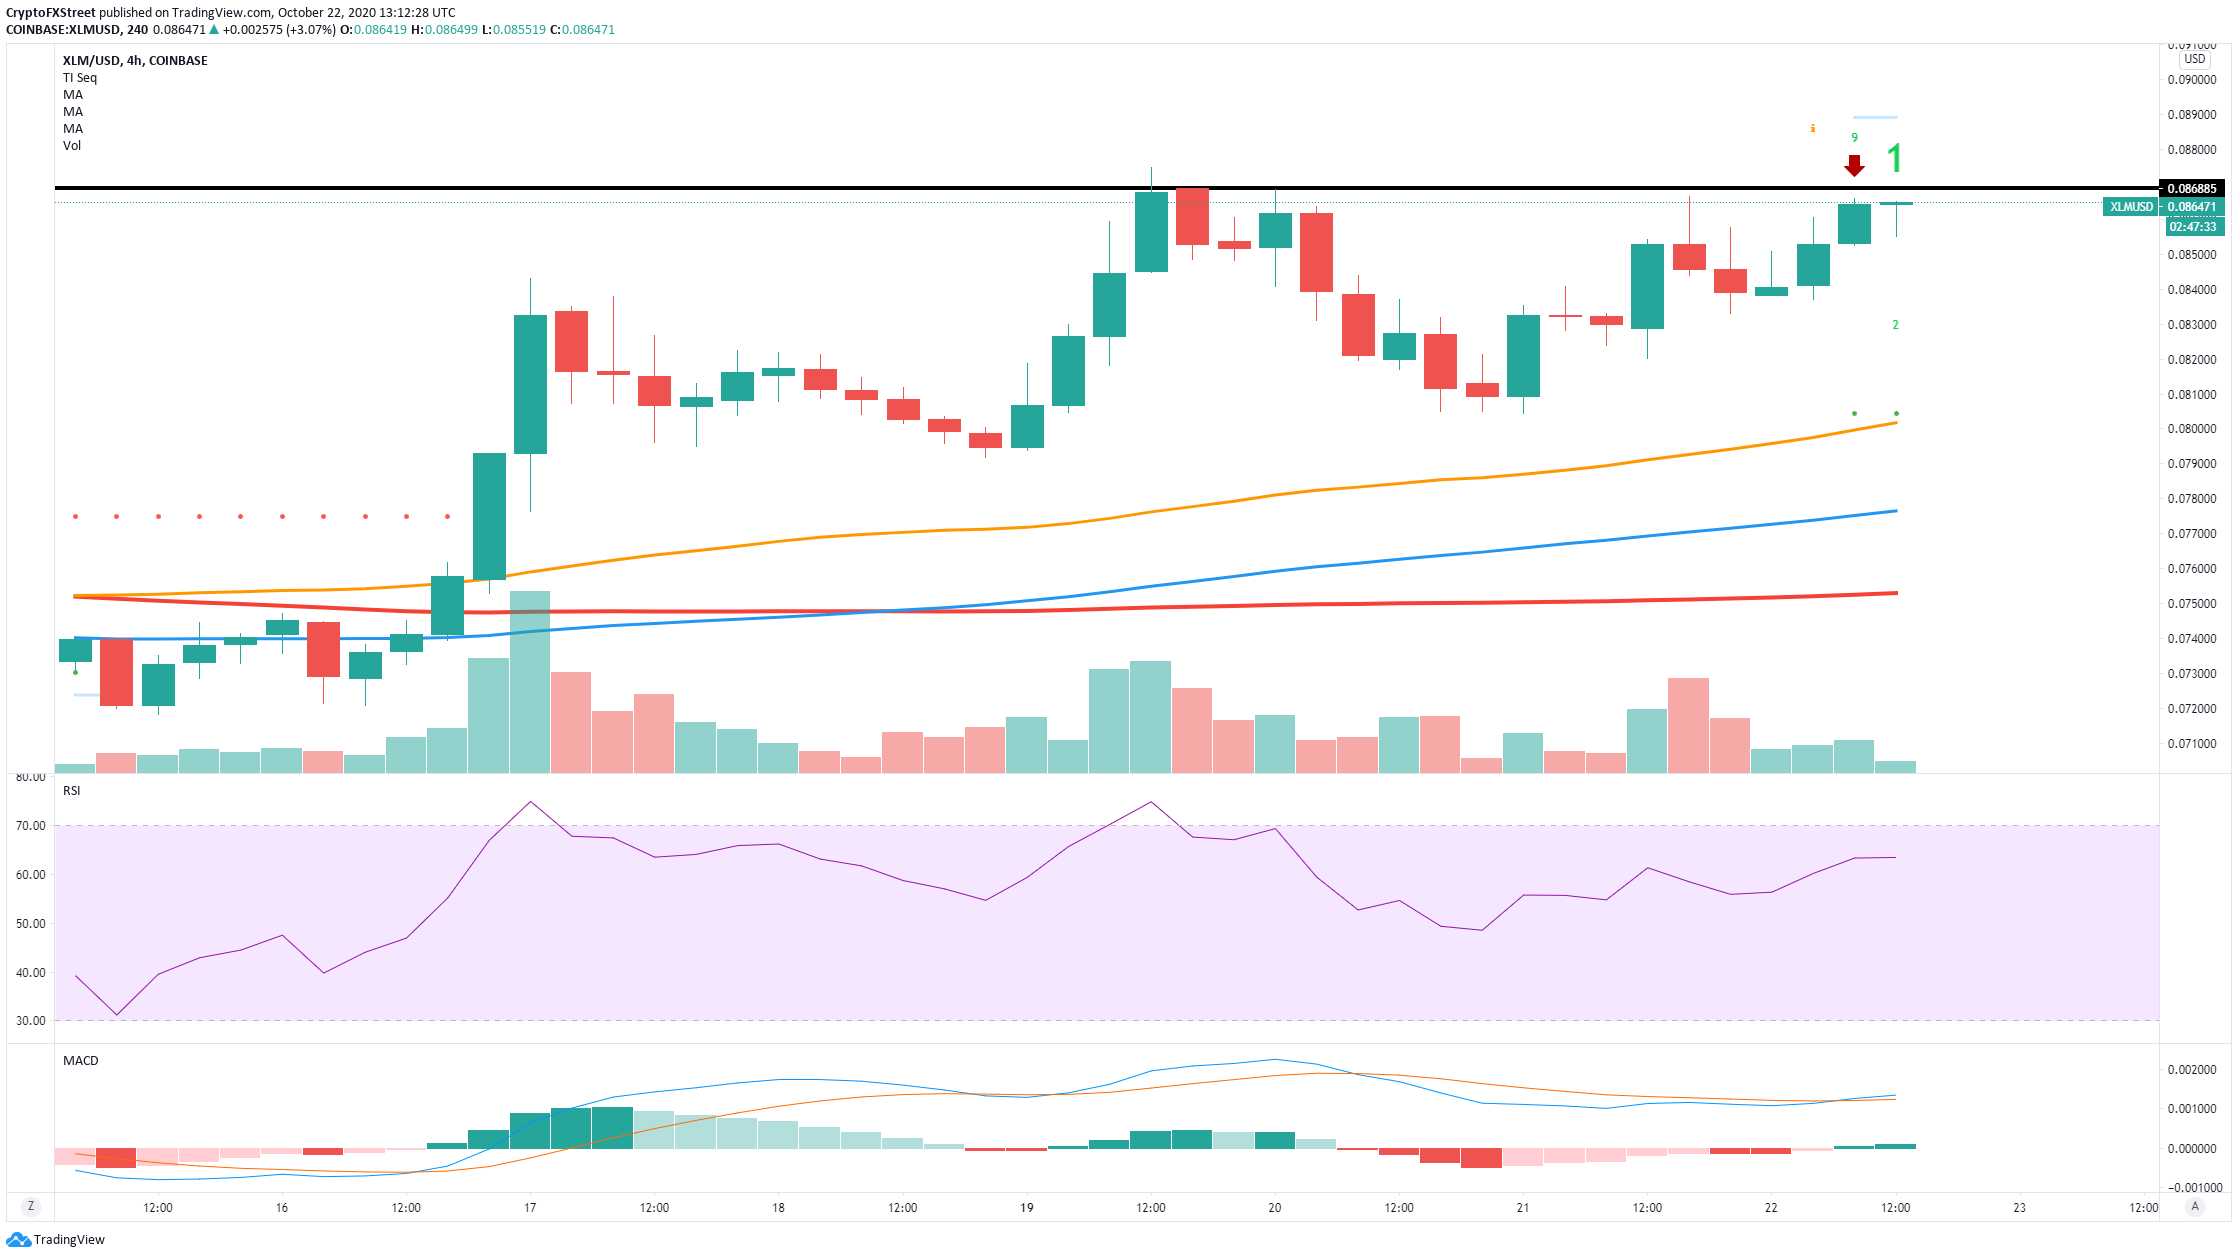
The most concerning bearish sign was presented in the 4-hour chart through the TD sequential indicator. The sell signal posted around three hours ago at a price of $0.086 indicates that XLM is bound for a pullback in the short-term.
On top of that, there is also a robust resistance level established at $0.0868 and tested several times in the past 48 hours. Confirmation of the sell signal can send XLM down to the 50-SMA at around $0.08 in the short-term, coinciding with another support level.
XLM/USD 12-hour chart
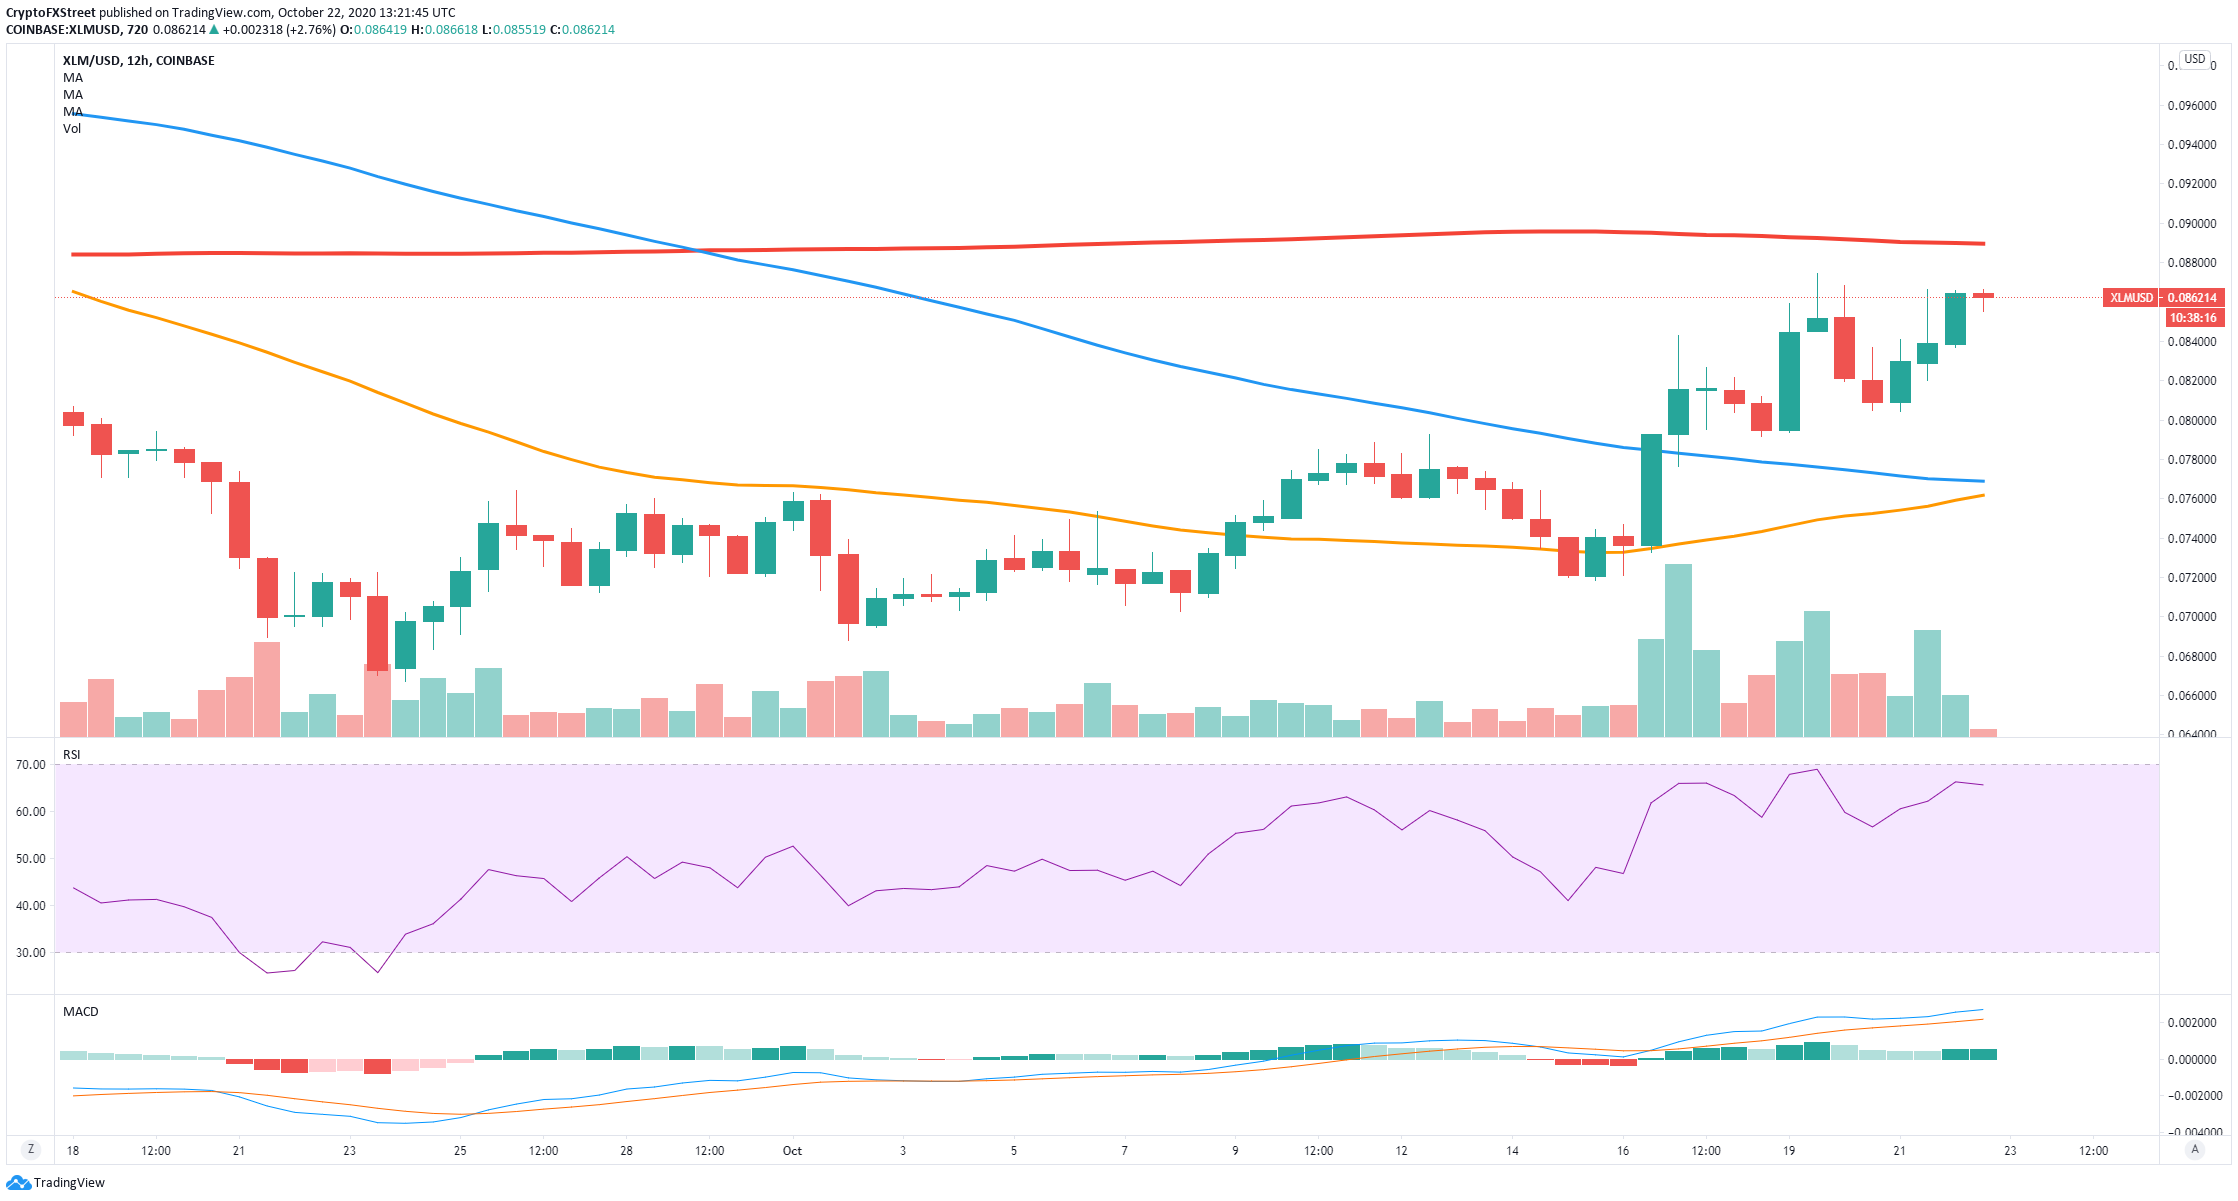
Despite the sell signal, the 12-hour chart is still in favor of the bulls and remains in an uptrend. The MACD is also bullish and gaining strength, and it seems that XLM can at least climb to $0.09 where the 200-SMA is without many hurdles.
Furthermore, if bulls can crack the resistance level at $0.09, Stellar's price can continue climbing up to $0.10, a resistance level established on September 2. The trading volume of XLM has increased and coincides with the bullish rally, adding strength to the positive outlook.
Critical price points for Stellar
XLM is definitely bullish after the entire market turned positive. Nonetheless, bulls face a challenging resistance level ahead at $0.09, and the TD indicator has presented a sell signal on the 4-hour chart. This could drive XLM down to $0.08.
On the other hand, bulls are still in control of the uptrend on the 12-hour and daily charts. A breakout above the critical level at $0.09 can most likely send XLM towards $0.10 as there aren't other resistance points above.
Author

Lorenzo Stroe
Independent Analyst
Lorenzo is an experienced Technical Analyst and Content Writer who has been working in the cryptocurrency industry since 2012. He also has a passion for trading.



