Stellar Lumens price looks poised for a big jump towards new yearly highs
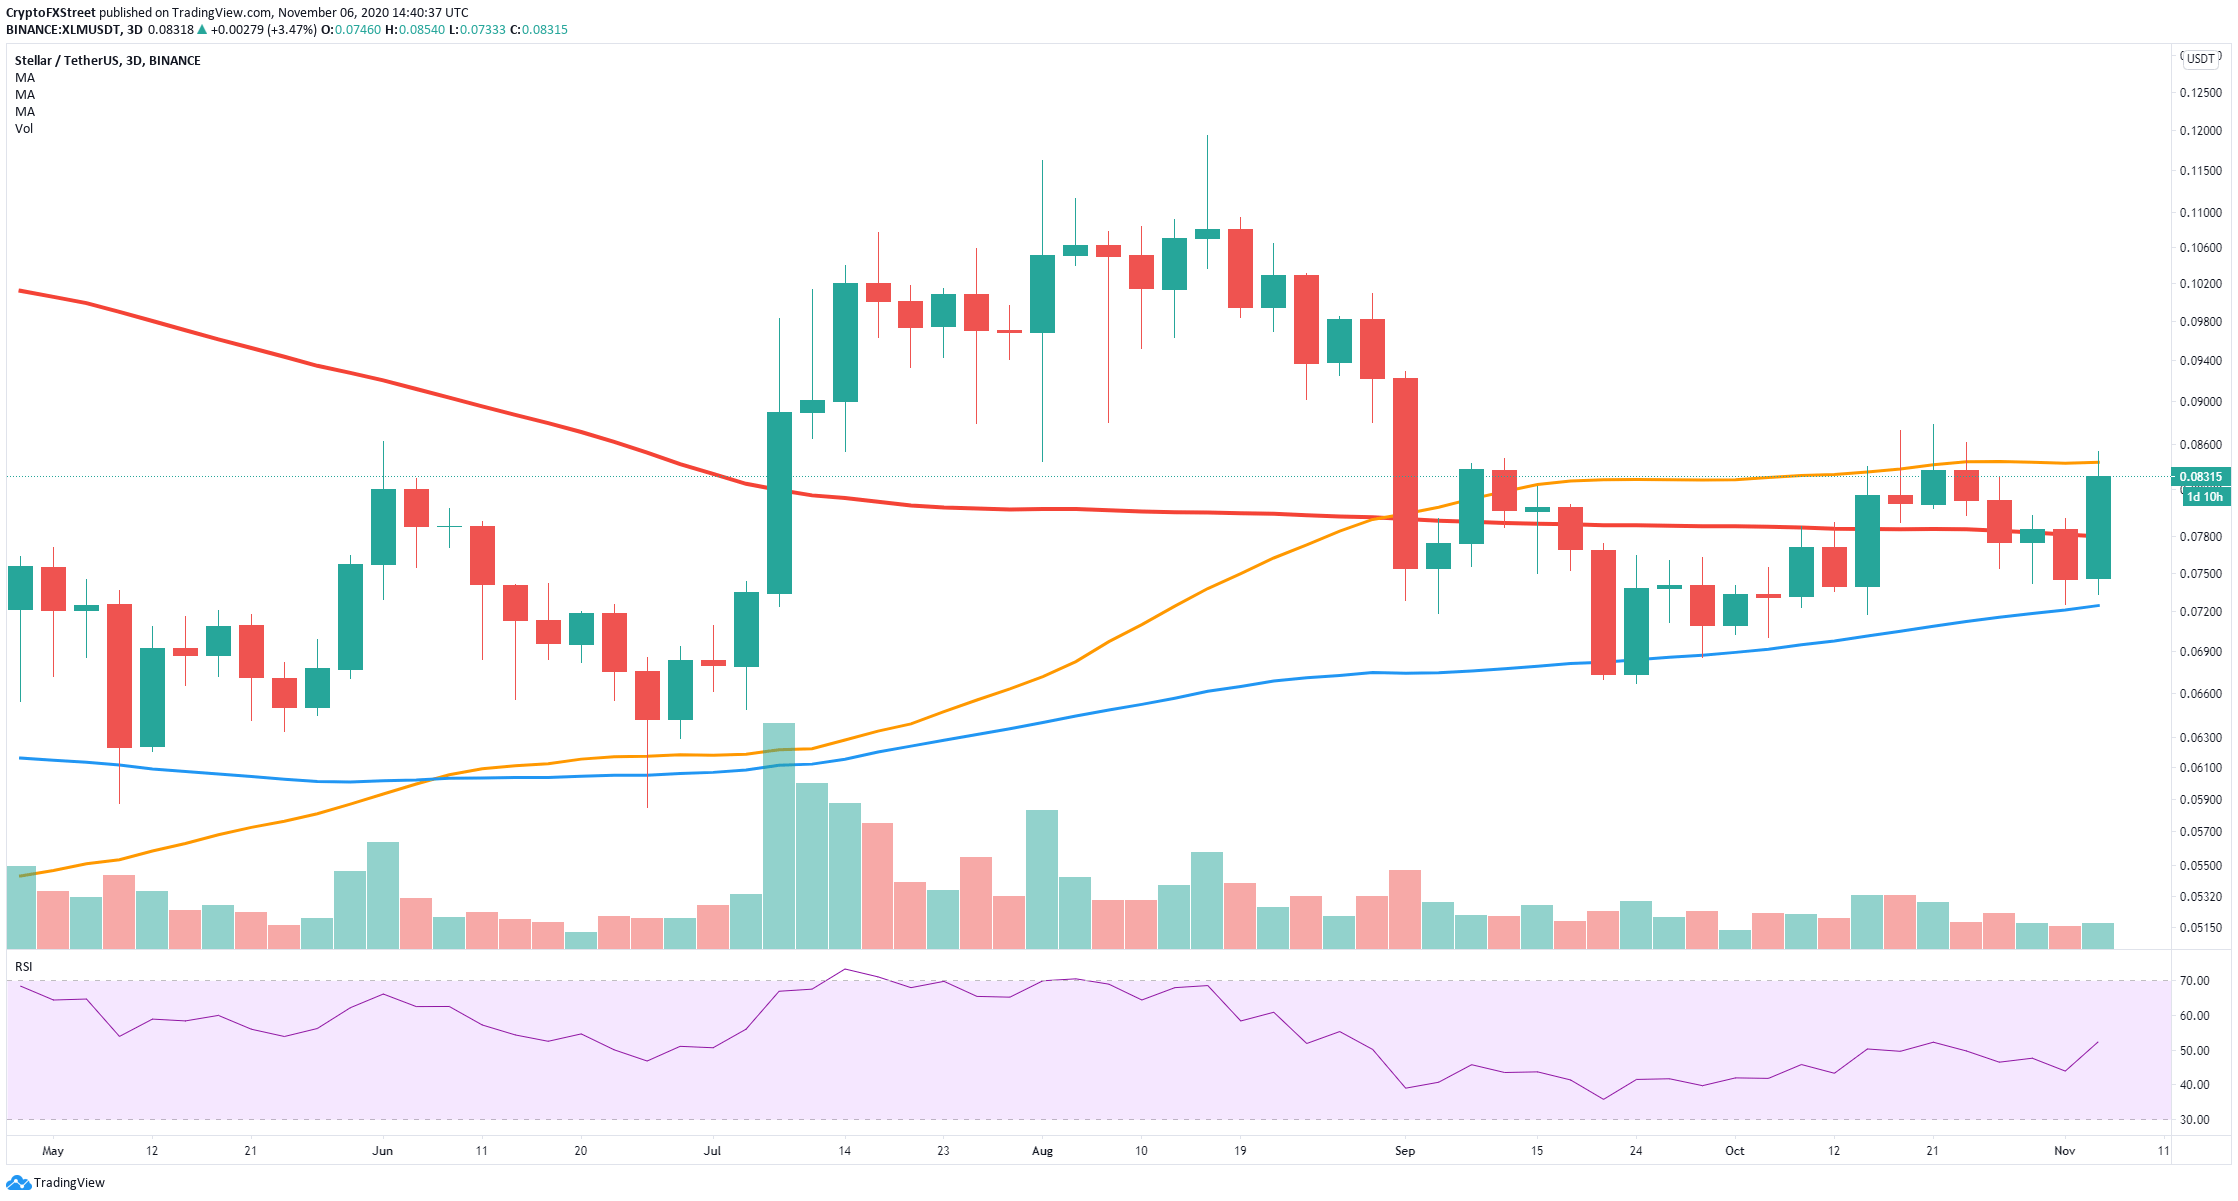
- XLM price remains bounded between the 100-SMA and the 50-SMA on the 3-day chart.
- Bulls are on the verge of pushing XLM above the 50-SMA aiming for $0.12.

In the last XLM article, published by FXStreet, there was a mention to a no-trade zone between the 50-SMA ($0.084) and the 100-SMA ($0.072) on the 3-day chart. The price of XLM is on the verge of a breakout above the 50-SMA, where it seems to be very little opposition above this critical resistance level until the 2020-high at $0.119.
XLM Price Prediction: Bulls aiming for $0.12 if a breakout above $0.084 is confirmed
The most critical resistance level is established at $0.084, where the 50-SMA stands on the 3-day chart. XLM price has been contained inside the space between the 50-SMA, being the top, and the 100-SMA, at $0.072, as the lower horizontal line.
XLM/USD 3-day chart
A breakout above $0.084 would easily drive the price of XLM towards the 2020-high at $0.119 as there are no other significant resistance levels to the upside. The Relative Strenght Index (RSI) is also not overextended and doesn't pose a threat for the bulls. Before the high at $0.119, $0.097 is a potential price target according to the Fibonacci Retracement indicator.
-637402706715377236.png)
XLM/USD 3-day chart
On the other hand, rejection from the 50-SMA would be a bearish sign. XLM could target the middle of the previously mentioned space at $0.077, which is the 200-SMA. If the level breaks, then the next price target would be $0.072, the 100-SMA.
Using the Fibonacci Retracement tool, it can be observed that a breakdown of $0.072 would lead the digital asset towards $0.0618 and potentially to $0.0461. The lowest price target is $0.0261, which would be the worst-case scenario.
Author

Lorenzo Stroe
Independent Analyst
Lorenzo is an experienced Technical Analyst and Content Writer who has been working in the cryptocurrency industry since 2012. He also has a passion for trading.


