Polkadot Price Prediction: DOT rebounds aiming for new record highs toward $30
- Polkadot embarks on another rally to new record highs after breaking above $22.
- DOT is in a price discovery mode; hence the bullish leg could quickly stretch to $30.
- A correction from the current price levels may seek support at $20 and the 50 SMA on the 12-hour chart.

DOT is back to trading above $20, a move that seems to have triggered massive buying orders. The least resistance path seems upwards from a technical perspective. However, a short term hurdle at $22 is standing in the way. Once broken, DOT will be pushing toward $30.
Polkadot spikes towards new all-time highs
DOT has risen above its recent record high and is aiming for a new historical high. The price is teetering around $21.8 amid an intense bullish push. Settling above the $22 mark might signal more buyers to join the market in the long run, pushing DOT toward $30.
The bullish narrative has been reinforced by the Moving Average Convergence Divergence (MACD). This indicator can be used to identify a trend’s direction in addition to calculating its momentum. The MACD also signifies positions to sell top or buy the bottom.
When the MACC line (blue line) lifts above the signal line, it is a buy position. On the other hand, a sell the dip position occurs when the MACD line crosses below the signal line. For now, the MACD shows that the bullish momentum has the potential to continue.
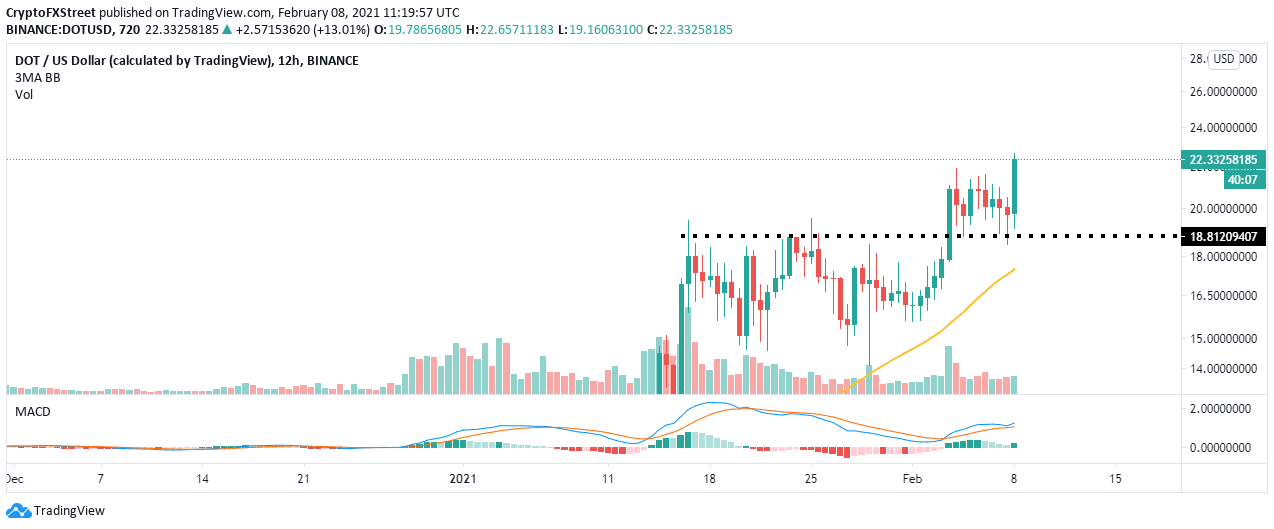
DOT/USD 12-hour chart
Looking at the other side of the fence
Polkadot is in price discovery, which means that we do not have a defined resistance zone. In other words, it essential to look at the possibility of overbought conditions using technical indicators like the Relative Strength Index (RSI).
In case of a correction, the initial point of contact would be $20. If declines continue, perhaps due to panic-selling, the cryptocurrency will explore the levels toward the 50 Simple Moving Average (SMA) on the 12-hour chart close to $18.
Author

John Isige
FXStreet
John Isige is a seasoned cryptocurrency journalist and markets analyst committed to delivering high-quality, actionable insights tailored to traders, investors, and crypto enthusiasts. He enjoys deep dives into emerging Web3 tren


