- Polkadot price has defended a crucial support level at $15.5 and aims for a strong rebound.
- The negative sentiment on social media is a bullish indicator.
- The digital asset faces a strong resistance barrier of around $18.
Polkadot has been trading inside an ascending parallel channel on the 4-hour chart since January 16. The digital asset has just rebounded from a crucial support level at $15.5 and could be aiming for a long-term price target of $19.
Polkadot price bounces towards $19 as on-chain metric turns bullish
DOT bulls have just defended the channel's lower trendline support on the 4-hour chart, at $15.5. Polkadot price is up by 14% since touching $15.25 and faces very little resistance to the upside until $18.
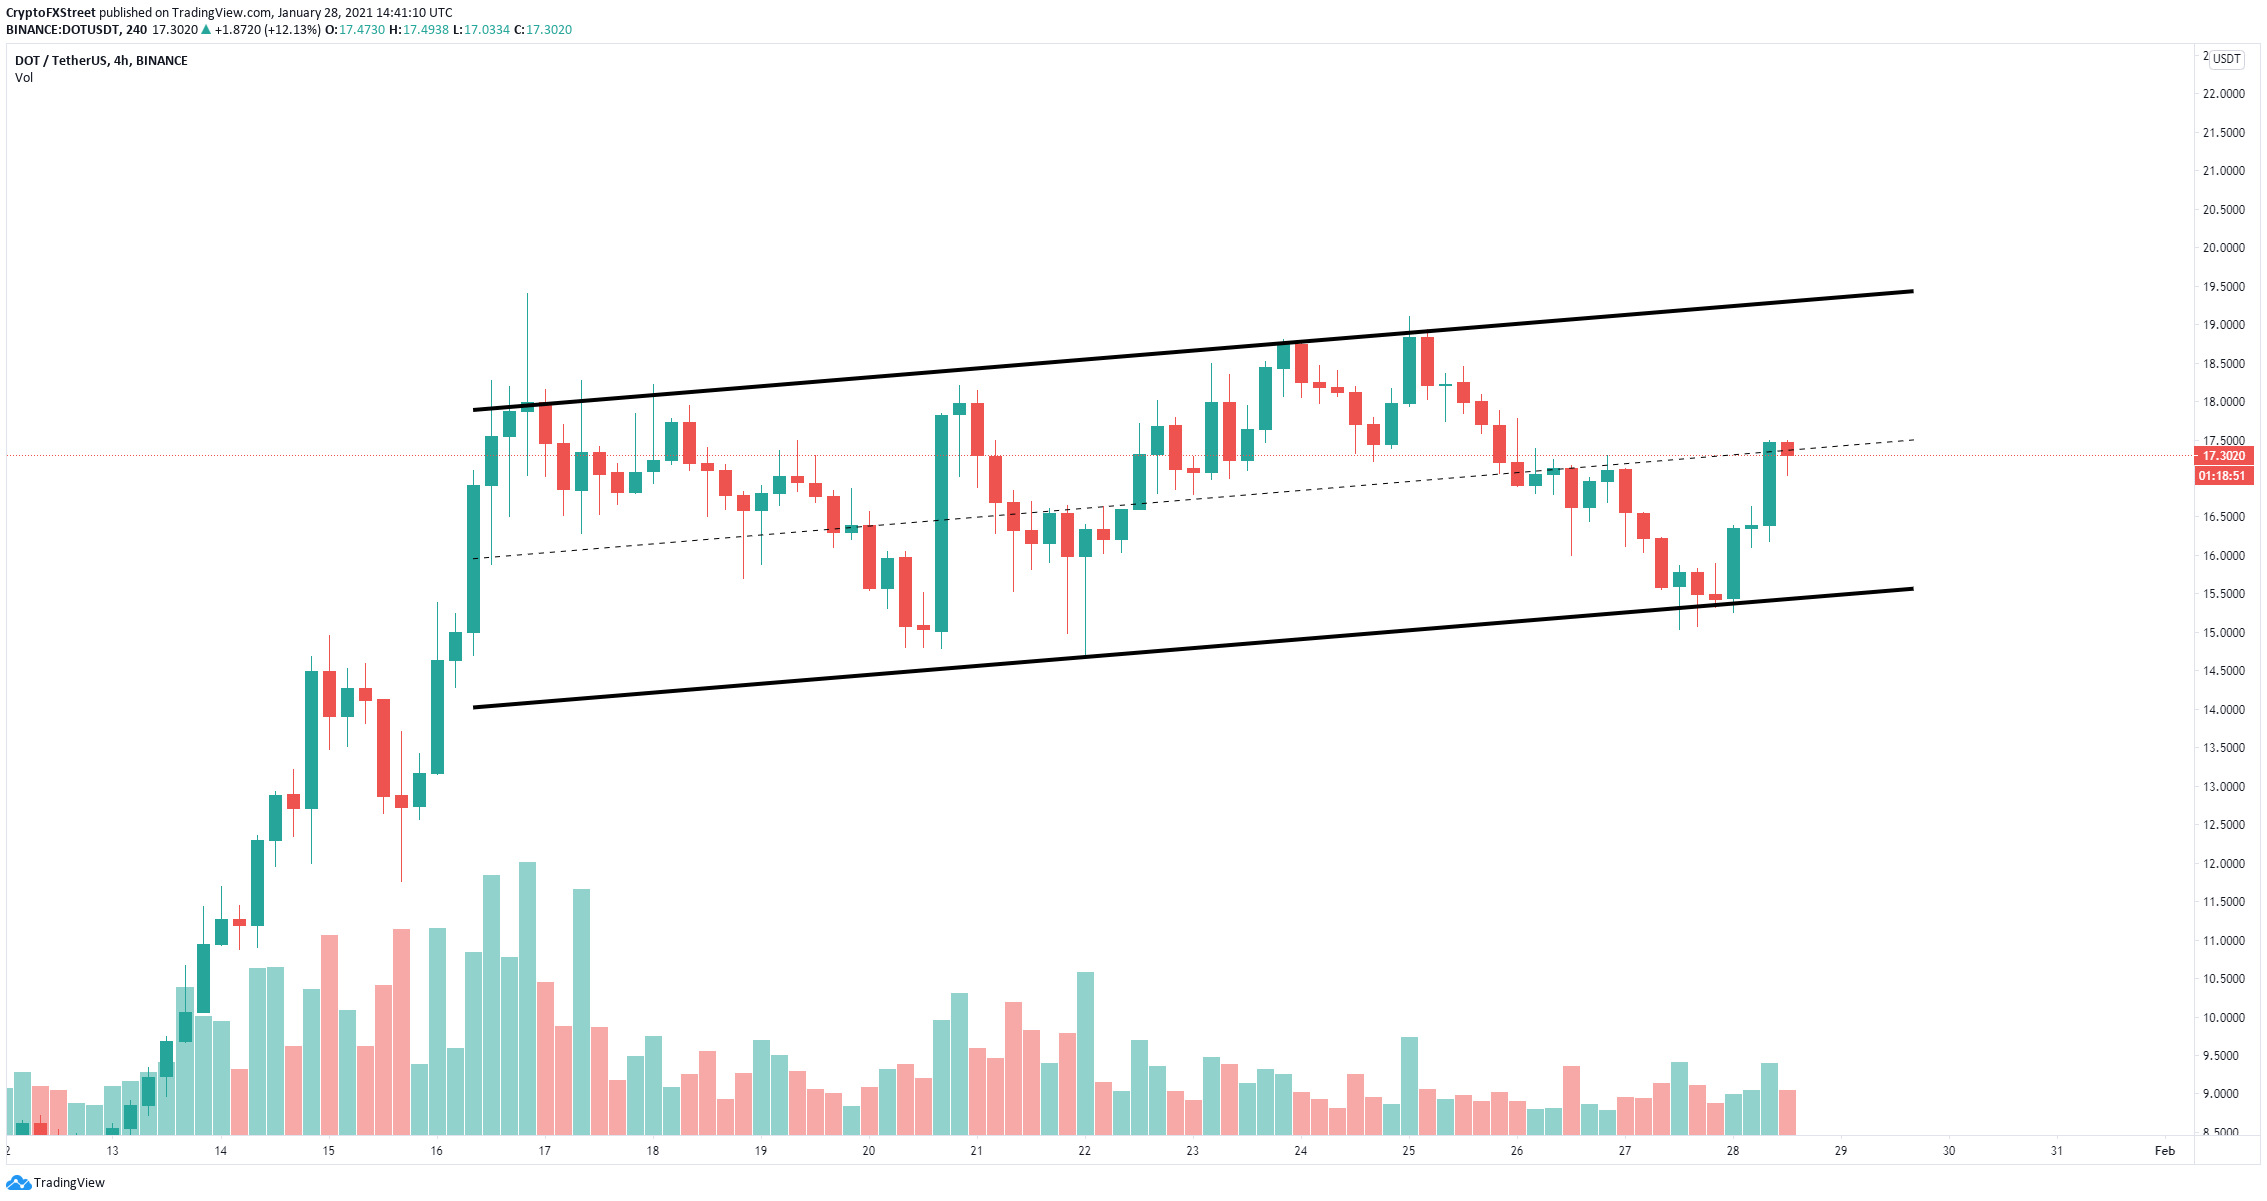
DOT/USD 4-hour chart
The Weighted Social Sentiment chart is currently negative for the past four days, which can usually translate into good buying opportunities. Similarly, when it’s positive and really high, Polkadot experiences pullbacks.
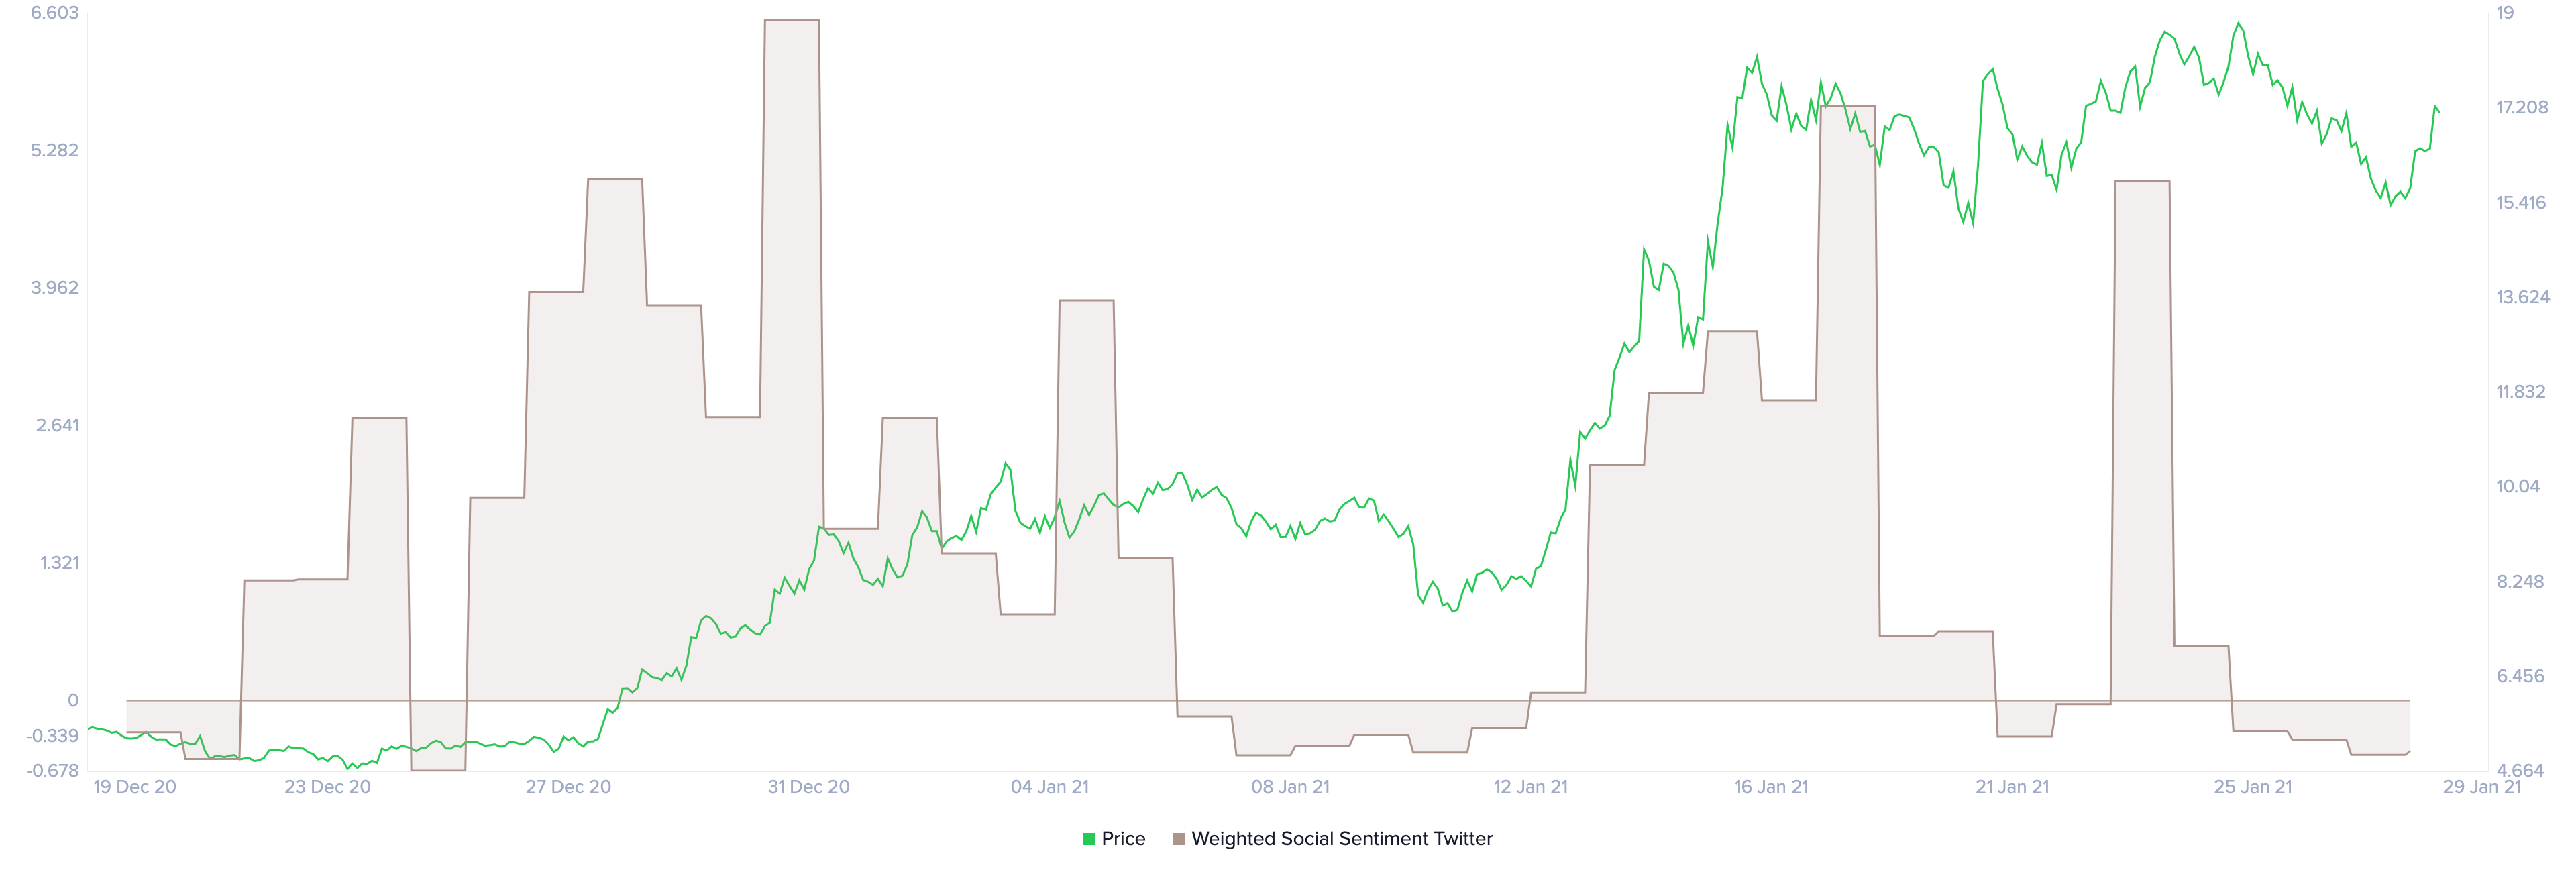
Polkadot Weighted Social Sentiment Twitter chart
Additionally, the overall social volume that Polkadot has received in the past week has declined significantly. This is another indication of a potential rebound as the low social volume can often lead to significant pumps.
Polkadot Social Volume
Nonetheless, the digital asset has some trouble climbing above the middle trendline of the parallel channel at $17.5. Rejection from this level can push Polkadot price down to the lower trendline at $15.5 again.
Note: All information on this page is subject to change. The use of this website constitutes acceptance of our user agreement. Please read our privacy policy and legal disclaimer. Opinions expressed at FXstreet.com are those of the individual authors and do not necessarily represent the opinion of FXstreet.com or its management. Risk Disclosure: Trading foreign exchange on margin carries a high level of risk, and may not be suitable for all investors. The high degree of leverage can work against you as well as for you. Before deciding to invest in foreign exchange you should carefully consider your investment objectives, level of experience, and risk appetite. The possibility exists that you could sustain a loss of some or all of your initial investment and therefore you should not invest money that you cannot afford to lose. You should be aware of all the risks associated with foreign exchange trading, and seek advice from an independent financial advisor if you have any doubts.
Recommended Content
Editors’ Picks
Ripple's move above this key level could trigger nearly 50% rally for XRP
Ripple has overcome a critical resistance level and flipped into a support floor on the weekly time frame. This development happened while XRP tightly consolidated for roughly 250 days. Investors can expect XRP to kickstart a massive rally.
Optimism price outlook with nearly $90 million worth of OP tokens flooding markets on Friday
Optimism volatility has shrunk in the ours leading to the network’s cliff unlock. It joins the likes of dYdX and Sui, which have similar events on their calendars. As token unlocks are often considered bearish catalysts, investors should brace for a reaction after the event.
Top 3 Price Prediction Bitcoin, Ethereum, Ripple: Retail watches from the sidelines with a bias for shorts
Bitcoin could clear $73,777 peak as BTC bulls resurface. Ethereum might fall 10% before next leg up as ETH RSI teases with sell signal. XRP could lose $0.6000 threshold as Ripple bulls fail to show up.
Jito price could hit $6 as JTO coils up inside this bullish pattern
Jito price action shows a potential cup and handle formation. Based on theoretical measurement rules, a successful breakout could yield a 56% rally to $6.0. A breakdown of the $3.86 support level would create a lower low for JTO and invalidate the bullish thesis.
Bitcoin: BTC may have recovered, but is it out of the woods?
Bitcoin’s (BTC) upward momentum has shown a significant decline for the past two weeks or so. This development led to a bearish signal on the weekly and an uncertain outlook on the monthly.