Polkadot Price Analysis: DOT set to test $25 amid bullish technical setup
- DOT/USD looks to extend the advance towards the $25 mark.
- 4H chart confirms symmetrical triangle breakout.
- The coin trades above all major averages.

Having faced rejection just shy of the $19 mark, Polkadot (DOT/USD) is consolidating the two-day rally this Sunday.
Despite the minor pullback, the altcoin holds above the $18 level and ditches the corrective downtrend seen across the crypto board last week.
The strength in the coin can be partly attributed to the sharp correction in Bitcoin, which has created an opportunity for the crypto traders to diversify into the DeFi tokens. While many analysts opine that Polkadot is also likely to gain a competitive advantage against Ethereum, as the price is seen rising further in the coming weeks.
Luis Cuende, the co-founder of the decentralized app company Aragon, noted:
While competitors to Ethereum are making strides and benefitting from the ongoing market rally, I think it’s very unlikely that these competitors will overcome the network effects that Ethereum has built. However, until Ethereum 2.0 is fully functional, Polkadot, cosmos and near are well-positioned to capture a meaningful market share.
DOT/USD: Bulls gearing up for further upside
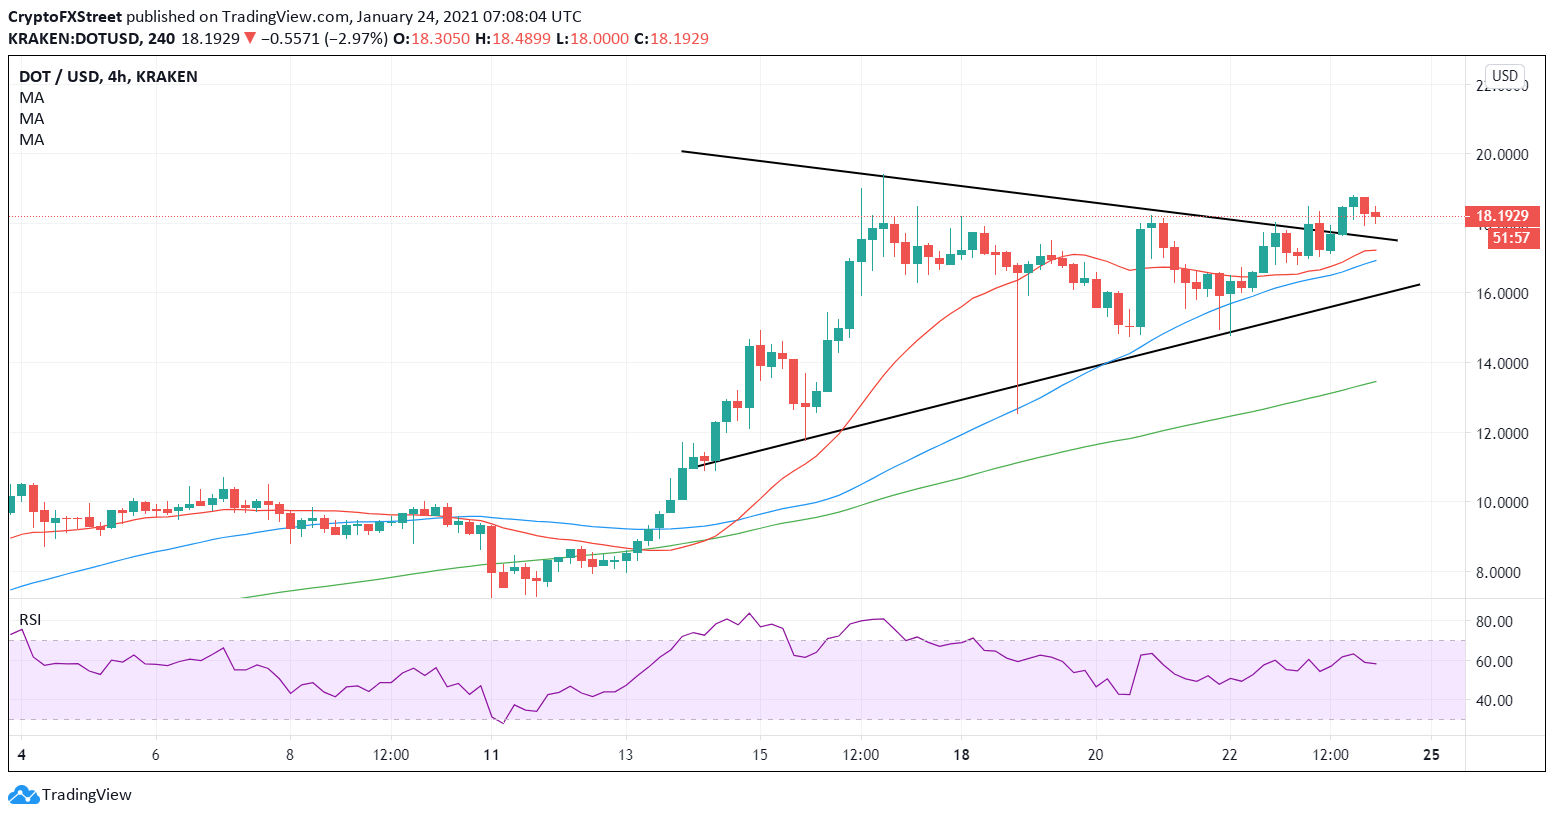
DOT/USD: Four-hour chart
Polkadot, which has climbed to the no.4 position among the top 50 widely traded digital assets, is seen extending the upside after the price confirmed a symmetrical triangle breakout on the four-hour chart early Saturday.
Subsequently, the altcoin rallied for a retest of the $19 hurdle but sellers continued to lurk near the latter, prompting a bullish consolidation phase.
The price continues to trade above all the major simple moving averages (SMA) on the four-hour sticks while the Relative Strength Index (RSI) stays well within the bullish region, both of which indicating more gains ahead.
A test of the measured target above $25 remains on the cards should the bulls find acceptance above the January 21 high of $19.40.
The psychological $20 level could come into play if the bulls extend their control.
Alternatively, the pattern resistance now turned support at $17.59 could limit the retracement.
A break below the last, fierce support around the $17 threshold could be threatened. That level is the confluence of the 21 and 50-SMAs.
Meanwhile, the bullish formation will get invalidated on a sustained move below the falling trendline (pattern) support at $15.96.
Author

Dhwani Mehta
FXStreet
Residing in Mumbai (India), Dhwani is a Senior Analyst and Manager of the Asian session at FXStreet. She has over 10 years of experience in analyzing and covering the global financial markets, with specialization in Forex and commodities markets.


