Polkadot Price Prediction: DOT primed for a 15% downswing after flashing a sell signal
- Polkadot stalls under $22 after rising to new all-time highs.
- Overhead pressure is bound to increase if DOT loses support at $20 and $18.8.
- The downswing to $17 will be invalidated if DOT closes the day above $20, potentially extending price action past $22.

Polkadot has experienced a massive upsurge in price as well as market value. DOT is now a $17.9 billion project and currently in the fourth spot after displacing Ripple (XRP). However, a sell signal puts the accrued gains in jeopardy, suggesting that a breakdown may extend to $17.
Polkadot rejected at $22 as bears swing into action
Polkadot’s uptrend hit a new all-time high after breaking above a critical resistance zone at $18.8. The bullish leg extended above $20 but failed to continue above $22. At the time of writing, DOT is teetering at $20 amid an ongoing retreat.
The resistance-turned-support at $18.8 will stay in line to provide an anchorage. Nonetheless, if bulls lose control over the price, losses would go as far as the confluence being formed by the 50 Simple Moving Average and the 100 SMA on the 4-hour chart.
Similarly, the breakdown appears to have been validated by the Relative Strength Index. This indicator points out overbought and oversold levels of the asset. Currently, the RSI is retreating from the overbought region, implying that the declines may continue.
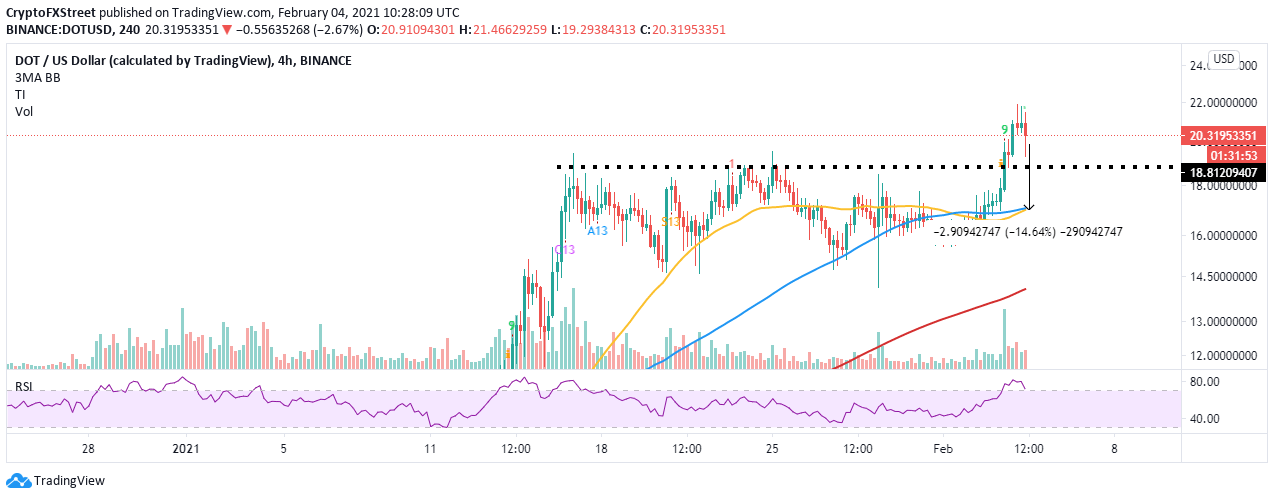
DOT/USD 4-hour chart
The TD Sequential indicator has recently presented a signal taking the form of a green nine candlestick. Selling pressure has begun to increase, which adds credence to the pessimistic outlook. In this case, Polkadot is likely to drop in one to four 4-hour candlesticks. As mentioned, support at $17 will come in handy, but if push comes to shove, DOT may revisit the 200 SMA at $14.5.
Polkadot social media mentions skyrocketed in the last 24 hours, according to Santiment, a leading behavioral analytics platform. The social volume tool tracks DOT-related mentions on hundreds of social media channels.
A graph representing that data highlights a significant rise, but this is usually a bearish signal because the investor sentiment tends to shift towards selling and not buying. Polkadot is unlikely to continue with the uptrend, especially with such a high social presence.
%20[12.50.28,%2004%20Feb,%202021]-637480309374750238.png)
Polkadot social volume
Looking on the other side of the picture
If Polkadot manages to stay above $20, the bullish outlook may be rejuvenated. Simultaneously, holding above $18.8 is still good enough to restart the uptrend to new record highs. On the upside, DOT will enter price discovery on trading above $22, implying that the target on the upside would be undermined. However, a conservative prediction is settling between $25 and $30.
Author

John Isige
FXStreet
John Isige is a seasoned cryptocurrency journalist and markets analyst committed to delivering high-quality, actionable insights tailored to traders, investors, and crypto enthusiasts. He enjoys deep dives into emerging Web3 tren


