Polkadot Price Prediction: DOT poised to rush to $3 as social volume tanks
- Polkadot provides a platform for blockchains to transfer all data seamlessly without compromising security.
- DOT/USD eyes $3.00 amid bearish calls from both technical and on-chain analysis.

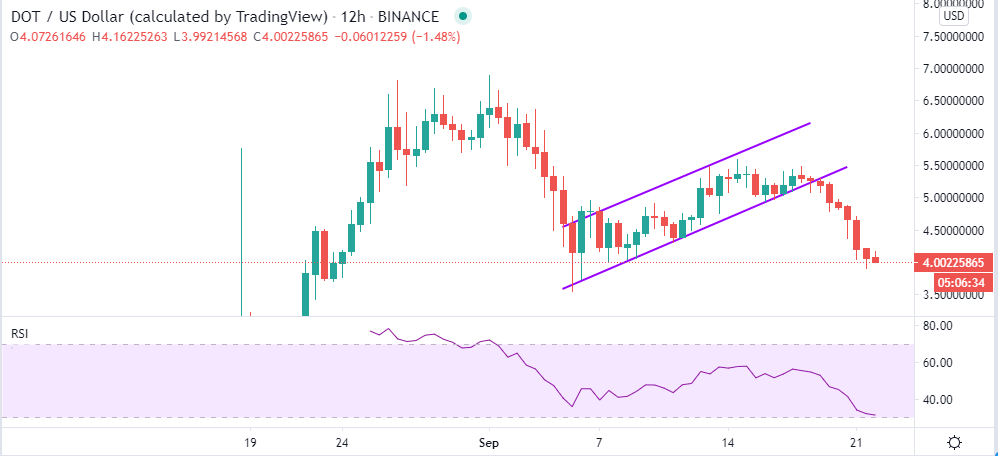
Polkadot has been on the retreat since it traded an all-time high at $6.88 on September 1. The initial drop in the first week of September embraced support at $3.50. A recovery ensued with the token stepping above several resistance levels. However, DOT failed to rally towards the yearly high, hitting a snag at $5.50.
The widespread losses in the last week didn’t spare Polkadot. Meanwhile, the token is teetering at $4.00, following an 11% loss recorded in the previous 24 hours. Generally, the trend is bearish, suggesting that the downtrend is far from over.
Polkadot overview
Polkadot is a relatively new cryptocurrency that has experienced immense growth since its launch in May 2020. The platform is a development of Switzerland’s Web3 Foundation. It is designed as a sharded protocol that allows decentralized blockchains to operate in the same environment seamlessly and scale. Development of the platform “is on track to deliver the most robust platform for security, scalability and innovation.
Users of the platform can perform cross-blockchain data of different forms as well as assets. To ensure that transactions are scalable to high levels, Polkadot has employed a method that lets “a common set of validators to secure multiple blockchains.” As far as upgrades are concerned, Polkadot does not require any hard forks to bring onboard new features and fix bugs.
Polkadot's downtrend remains unstoppable
As earlier mentioned, Polkadot recovered from the dip in September’s first week but failed to sustain gains toward the all-time high. However, the recovery within the parallel ascending channel confirmed the formation of a bear flag pattern impacting the ongoing losses.
The Relative Strength Index (RSI) emphasizes the bearish trend as it nears the oversold region. If the downward momentum remains intact, DOT will eventually spiral to the support at $3.50 and $3.00 confirming a prediction made at an earlier date.
DOT/USD 12-hour chart
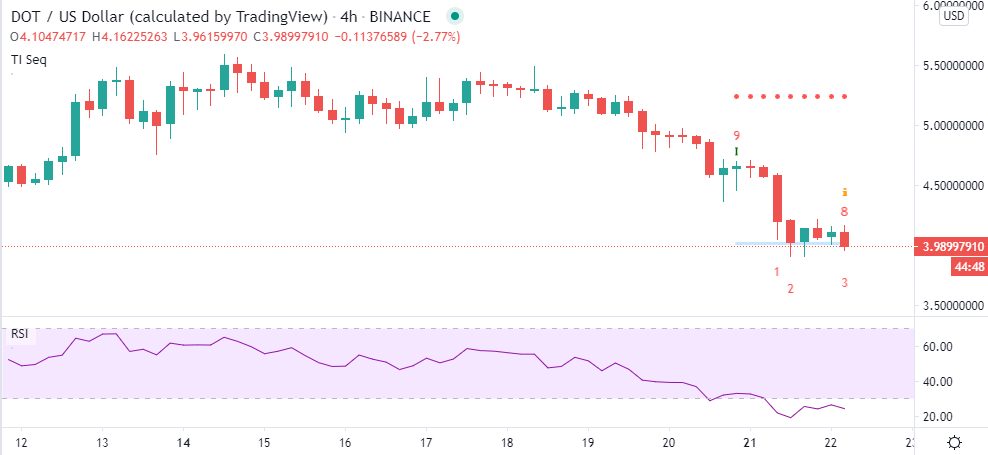
The TD Sequential Indicator highlighted a sell signal on DOT’s 4-hour chart, emphasizing the downtrend. The bearish picture was also confirmed by a Doji candlestick leading to the eventual dive to $4.00. The latest sell signal is presented in the form of a red eight candlestick suggesting that DOT is poised for declines in the short term.
DOT/USD TD Sequential
Polkadot social volume continues to fall amid the dwindling price. There was a spike in the social volume on September 12, followed by a brief rally in the price. At the moment, the social volume has dived to 6 (half the volume on September 12). The history of DOT shows that a price rally usually succeeds in a spike in social volume. At the same time, a decrease in social volume tends to culminate in low or falling prices.
DOT one-month social volume
 [10.33.59, 22 Sep, 2020]-637363586265314314.png)
Looking at the other side of the fence
All indicators hint that Polkadot is heading to levels lower than the prevailing market value. However, if support at $3.50 holds its ground, there is a chance that the bearish leg to $3.00 will be invalidated. Moreover, if the RSI holds above 30 and turns in favor of a sideways trend, consolidation could begin with DOT remaining pivotal at $4.00.
Author

John Isige
FXStreet
John Isige is a seasoned cryptocurrency journalist and markets analyst committed to delivering high-quality, actionable insights tailored to traders, investors, and crypto enthusiasts. He enjoys deep dives into emerging Web3 tren


