Polkadot Technical Analysis: DOT breakdown to $3.50 seems imminent
- Polkadot is holding at the edge of a cliff; fall to $3.50, critical support is gaining traction.
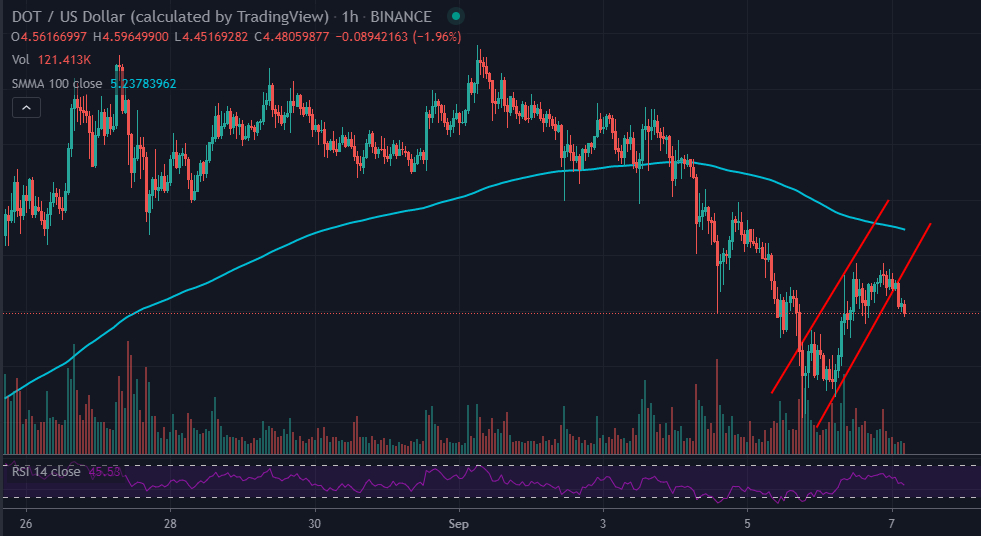
- DOT/USD under the impact of a flag pattern hence the likelihood of a drop back to $3.50.

Polkadot, one of the fastest-growing governance cryptocurrencies, is working hard to overcome the resistance at $5.00. The fight for a breakout comes after a fall to support at $3.50. The massive breakdown occurred after DOT/USD traded a new high at $6.89 (at the beginning of September).
Before the breakdown, Polkadot rallied due to listings on a couple of the world’s largest exchanges; Coinbase and Binance. Just after the listing on Binance, on August 19, DOT hit highs of $5.75. A flash drop followed with the price testing $1.00. The token that promises to bring forth true interoperability and governance over the network then recovered to around $3.00.
Consequently, the last week of August resulted in massive gains where Polkadot rose above the former resistance at $5.75 and traded new highs at $6.89. Unfortunately, the price stalled, which left the critical $7.00 level untested. Earlier last week, DOT/USD embraced support at $5.50 before the entire cryptocurrency dropped in unison on Thursday and Friday.
DOT/USD tumbled, confirming support at $3.50. Interestingly the seventh-largest cryptocurrency commenced another recovery over the weekend. The rally was significant to the extent of rising above $4.00.
At the moment, Polkadot is trading at $4.51 after a shallow retreat from levels close to $5.00. Meanwhile, the price is trading below a bearish flag pattern, leading to more losses that could explore under $4.00. Similarly, the Relative Strength Index (RSI) falls towards the oversold and illustrates that the bearish grip keeps getting stronger.
Upwards, the resistance at $5.00 must be broken for DOT to get leeway for gains eyeing the key hurdle at $7.00. The 100 Simple Moving Average (SMA) in the hour range is in line to hinder growth at $5.23. As long as the resistance at $5.00 remains unbroken, the looming breakdown to the recently confirmed support at $3.50 will continue drawing closer.
DOT/USD 1-hour chart
Author

John Isige
FXStreet
John Isige is a seasoned cryptocurrency journalist and markets analyst committed to delivering high-quality, actionable insights tailored to traders, investors, and crypto enthusiasts. He enjoys deep dives into emerging Web3 tren


