- Polygon price saw a negative move in the ASIA-PAC trading sell-off.
- MATIC is currently nearly unchanged for the day, but the risk of an accelerated down move enlarges.
- The bond market hangs against the ropes and carries risk assets with it.
Polygon (MATIC) price tanked slightly around the US opening bell as markets are still pricing in the turn of events from past Friday on the back of the US jobs report. With a steep increase in the number of jobs added and overall wages still growing, it seems that inflation is not going away quietly. For the whole of January, markets have been pricing in a Goldilocks scenario that predicted no recession and interest rate cuts in the second half of the year. MATIC jumped 64% on the back of that. With markets reassessing now that a tight labor market may offer up renewed inflation, that rally could halt and unwind.
Polygon price set to be rewarded as January trade went too far
Polygon price advanced nearly 64% since January 1 as markets ignored the warnings from individual central bankers who had continued to say interest rates would remain high. Traders did not ask enough questions and simply were riding along the trend, which pushed risk assets into recovery with some even erasing the incurred losses from last fall. The door got slammed on those same traders with the US jobs report last Friday when the expectation of 185k new jobs in January was destroyed by an official 517k figure. The risk is that the US inflation number for later this week could be status quo, or worse, an increase.
MATIC thus sees the weight of a risk premium being factored in. With the sharp decline in bond prices, yields are soaring, and the US Dollar is stronger. This translation into MATIC price has not happened but means that the green ascending trend line could soon snap and make Polygon price free fall to $0.96 in a 20% market correction.
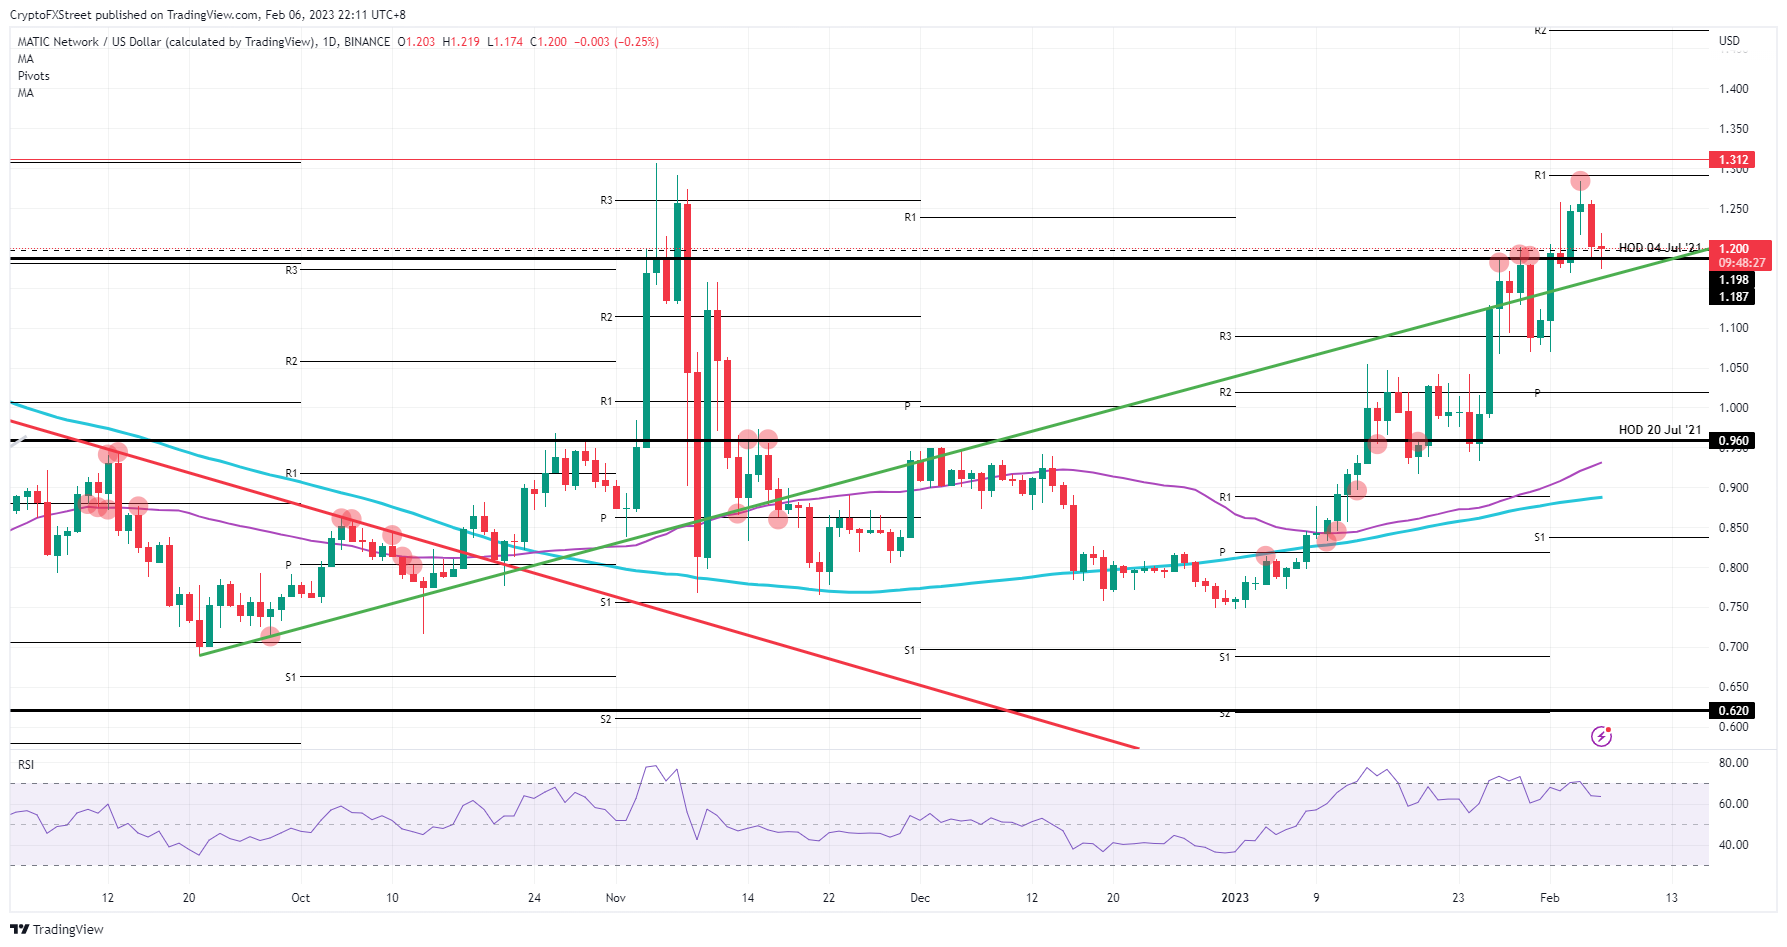
MATIC/USD daily chart
If the green ascending trend line holds any downward pressures, and this Monday morning continuation gets snapped, a swing back to $1.30 could be in the cards. Although the Relative Strength Index has not traded further toward 50, there is ample room for some upside. Expect to see a test at $1.312 quite soon if this recovery continues into the week.
Information on these pages contains forward-looking statements that involve risks and uncertainties. Markets and instruments profiled on this page are for informational purposes only and should not in any way come across as a recommendation to buy or sell in these assets. You should do your own thorough research before making any investment decisions. FXStreet does not in any way guarantee that this information is free from mistakes, errors, or material misstatements. It also does not guarantee that this information is of a timely nature. Investing in Open Markets involves a great deal of risk, including the loss of all or a portion of your investment, as well as emotional distress. All risks, losses and costs associated with investing, including total loss of principal, are your responsibility. The views and opinions expressed in this article are those of the authors and do not necessarily reflect the official policy or position of FXStreet nor its advertisers. The author will not be held responsible for information that is found at the end of links posted on this page.
If not otherwise explicitly mentioned in the body of the article, at the time of writing, the author has no position in any stock mentioned in this article and no business relationship with any company mentioned. The author has not received compensation for writing this article, other than from FXStreet.
FXStreet and the author do not provide personalized recommendations. The author makes no representations as to the accuracy, completeness, or suitability of this information. FXStreet and the author will not be liable for any errors, omissions or any losses, injuries or damages arising from this information and its display or use. Errors and omissions excepted.
The author and FXStreet are not registered investment advisors and nothing in this article is intended to be investment advice.
Recommended Content
Editors’ Picks
Ethereum supply shrinks by 70,000 ETH. Will Ethereum price hit $2,000?

Ethereum transition from Proof-of-Work to Proof-of-Stake (PoS) was the last major upgrade to the altcoin’s blockchain and the Shanghai hard fork is the next one. The shift to PoS purged 70,000 ETH tokens from the altcoin’s circulating supply.
Decentraland Price Forecast: What to expect from MANA as Metaverse Fashion Week kicks off

Decentraland price (MANA) has identified critical support on day one of the Metaverse Fashion Week. The token is trading horizontally on the four-hour timeframe as bulls push to break above a descending trendline.
Ethereum devs confirm withdrawals to begin on April 12; Here's what to expect from ETH price

Ethereum is on the verge of bringing about one of the biggest upgrades to the blockchain since the Merge. The arrival of withdrawals has been anticipated for a long time now, however, it may not be as lucrative for Ethereum price as one might expect.
Ripple holders' profit taking hits a 19-month high as XRP price shoots up by 42%
XRP price has performed beyond expectations and has marked a multi-month high, restoring confidence in its investors. These holders have also made the most of the situation and turned to sell, which could backfire on the price action soon.
Bitcoin: Should you trust this BTC sell signal or wait for $34,000?

Bitcoin price shows a clear picture of its rally after it breached a long-term bullish pattern in mid-January. As the rally takes a breather, sell signs have started to emerge, which is putting investors in a confused state.