- Polygon bridges have asserted their dominance with $2.18 billion of assets locked in the Ethereum-Polygon ERC-20 bridge.
- The value of assets locked in Polygon bridges is nearly twice that of Arbitrum, a layer-2 Ethereum scaling solution.
- MATIC price is on track to breakout of a symmetrical triangle on the 1D price chart with a target of $2,474.
Polygon, the Ethereum scaling solution is competing with Arbitrum and other layer-2 protocol’s bridges, asserting its dominance in the ETH ecosystem. The Ethereum scaling solution is on track to witness a bullish breakout from a symmetrical triangle pattern according to technical analysis of the Polygon token MATIC’s price chart.
Also read: Jim Cramer warns investors to stay away from crypto: another buy signal for Bitcoin?
Polygon dominates Ethereum scaling solutions with high value of assets locked
Polygon, the layer-2 scaling solution for the Ethereum network has asserted its dominance among other protocols. The Polygon-Ethereum bridge is a system that allows for the transfer of assets between the Ethereum mainnet and the Polygon (formerly known as the Matic) network. It enables users to move assets, such as ERC-20 tokens, from the Ethereum mainnet to the Polygon network, where they can be used in faster and cheaper transactions.
The Polygon-Ethereum bridge has $2.18 billion worth of assets locked. This is nearly twice the value of assets locked between the Ethereum-Arbitrum bridge which stood at $1.36 billion. Polygon’s bridge has established its dominance.
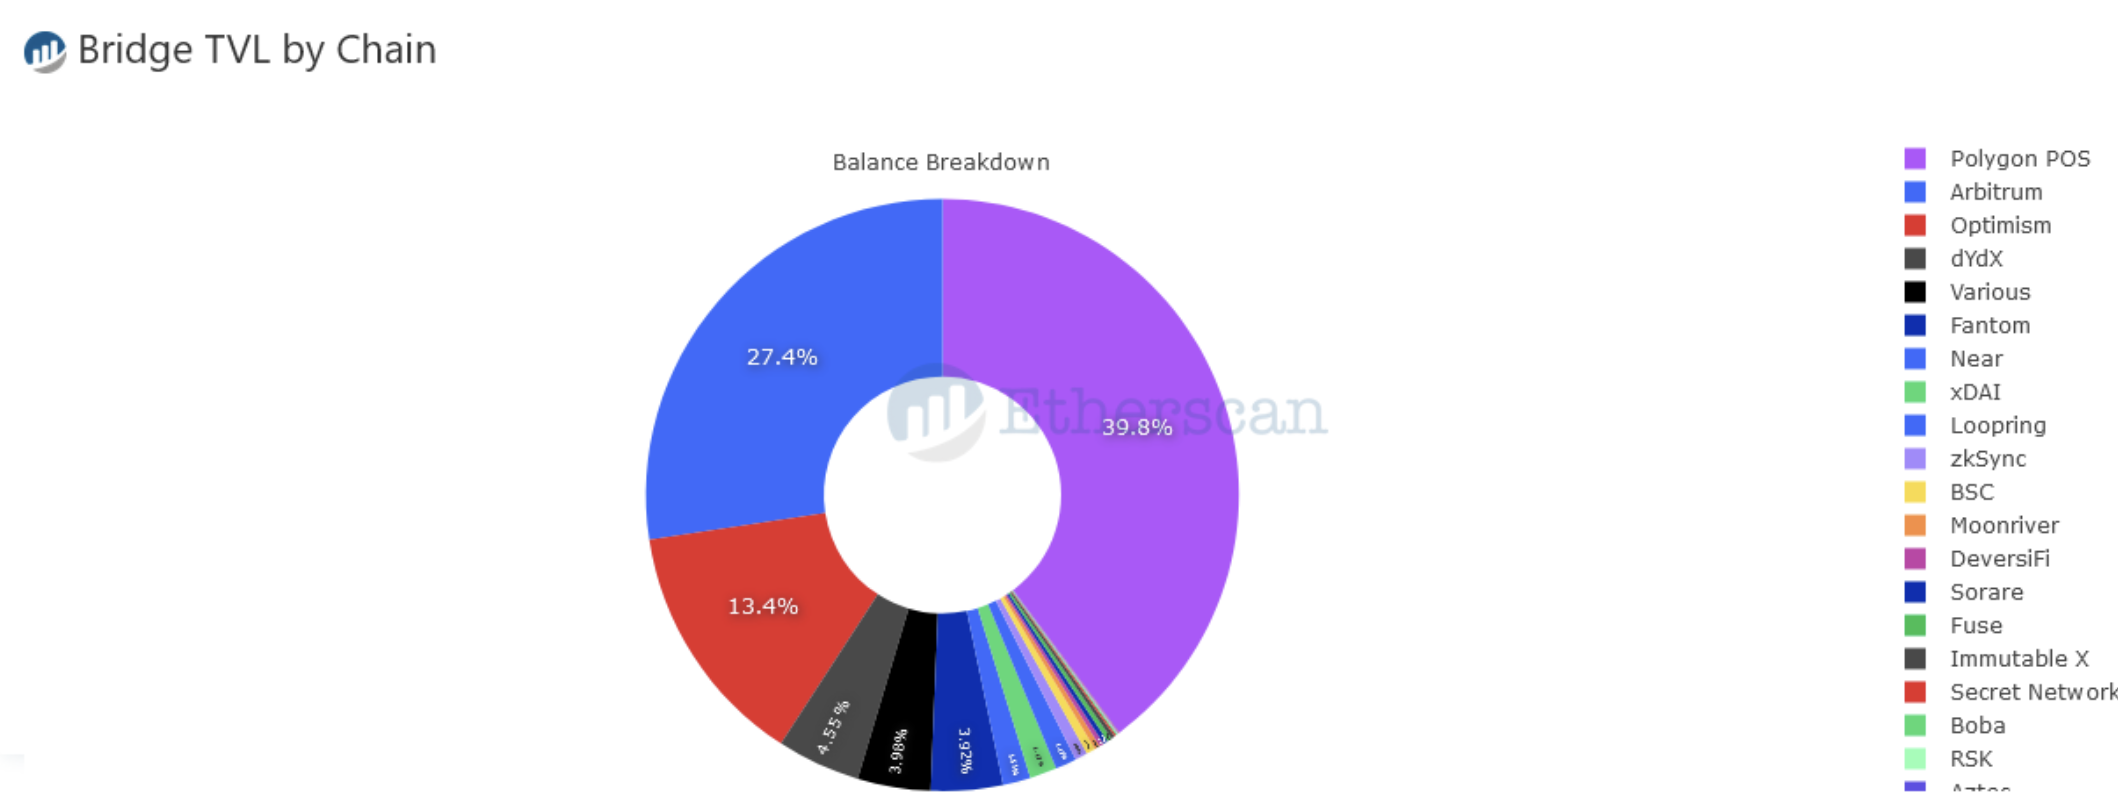
Polygon Ethereum bridge
MATIC price is on track to hit the $2,474 target
MATIC, the native token of the Polygon network, is currently trading within a symmetrical triangle. As seen in the chart below, MATIC is on track to witness a bull run to the $2,474 target. Using the Bulkowski Measure rule, the symmetrical triangle’s upward breakout target is $2,474, after taking the difference between A and B and adding it to the 58% percentage meeting price target for an upward breakout.
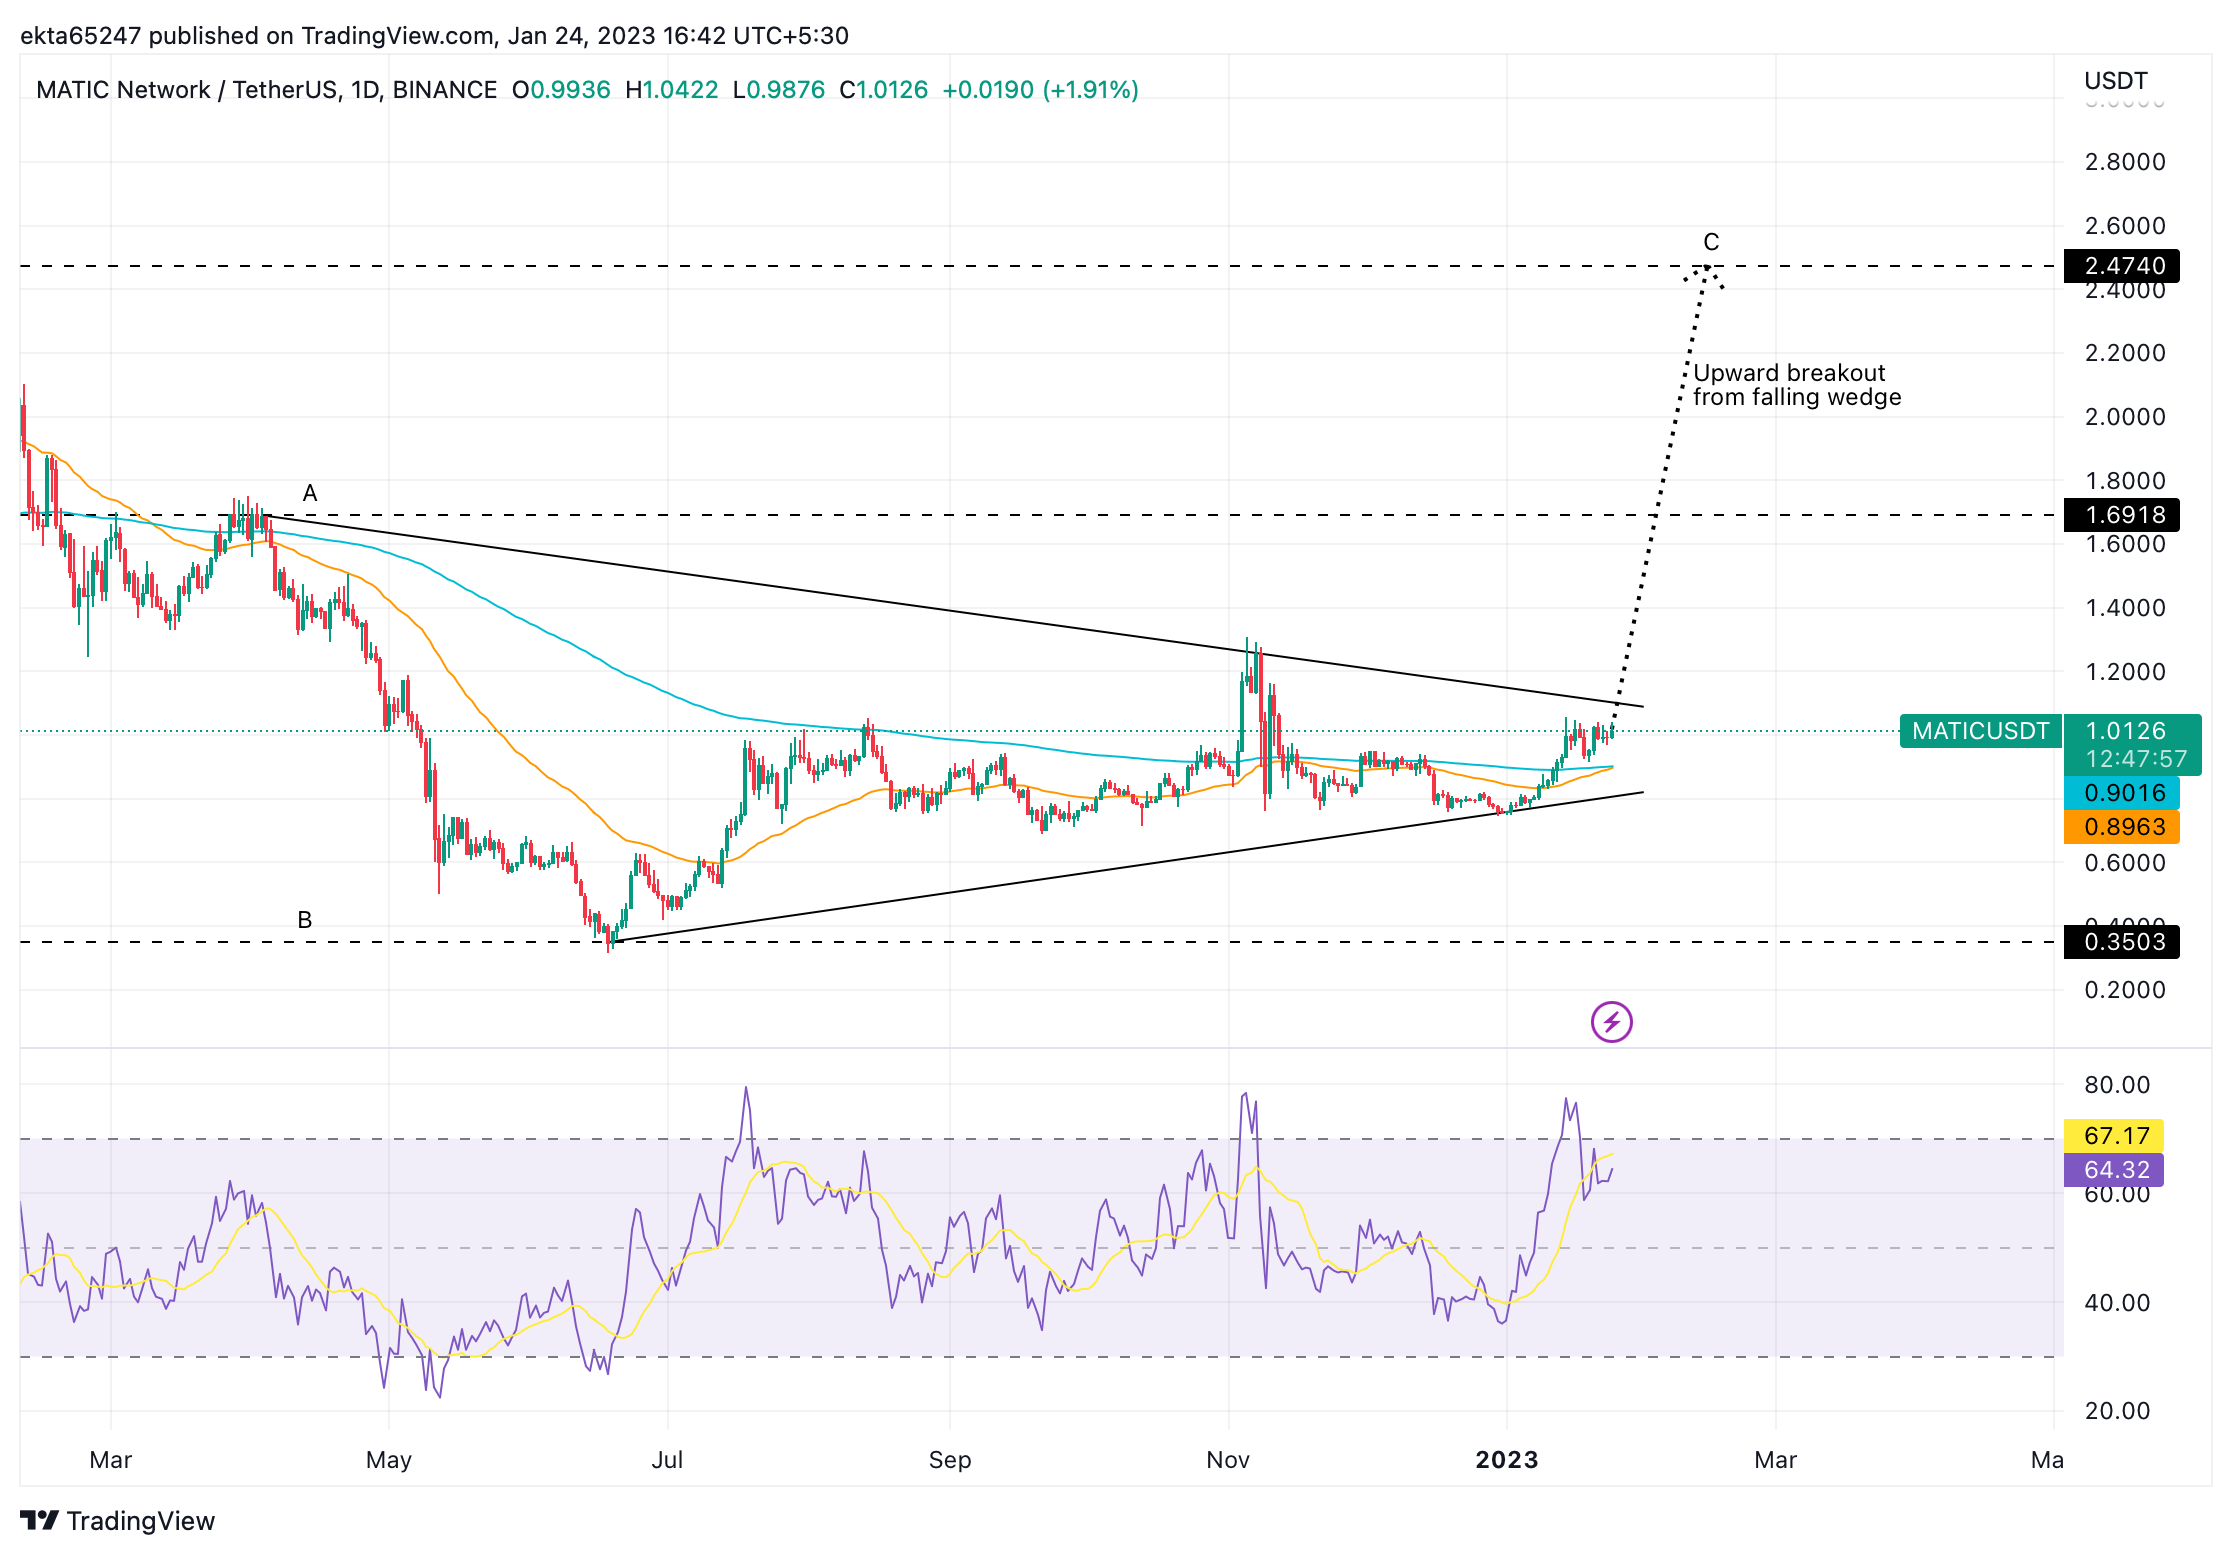
MATIC/USDT price chart
The Relative Strength Index (RSI) momentum indicator reads 64.32, it is below the overbought level of 70. This implies there is room for MATIC price to climb higher.
However, a drop below the lower trendline forming the symmetrical triangle, or the confluence of the 50-day and 200-day Exponential Moving Averages (EMAs) could invalidate the bullish thesis for MATIC.
Information on these pages contains forward-looking statements that involve risks and uncertainties. Markets and instruments profiled on this page are for informational purposes only and should not in any way come across as a recommendation to buy or sell in these assets. You should do your own thorough research before making any investment decisions. FXStreet does not in any way guarantee that this information is free from mistakes, errors, or material misstatements. It also does not guarantee that this information is of a timely nature. Investing in Open Markets involves a great deal of risk, including the loss of all or a portion of your investment, as well as emotional distress. All risks, losses and costs associated with investing, including total loss of principal, are your responsibility. The views and opinions expressed in this article are those of the authors and do not necessarily reflect the official policy or position of FXStreet nor its advertisers. The author will not be held responsible for information that is found at the end of links posted on this page.
If not otherwise explicitly mentioned in the body of the article, at the time of writing, the author has no position in any stock mentioned in this article and no business relationship with any company mentioned. The author has not received compensation for writing this article, other than from FXStreet.
FXStreet and the author do not provide personalized recommendations. The author makes no representations as to the accuracy, completeness, or suitability of this information. FXStreet and the author will not be liable for any errors, omissions or any losses, injuries or damages arising from this information and its display or use. Errors and omissions excepted.
The author and FXStreet are not registered investment advisors and nothing in this article is intended to be investment advice.
Recommended Content
Editors’ Picks

Ethereum Price Forecast: Whales increase buying pressure as developers set April 30 for Pectra mainnet upgrade
Ethereum (ETH) has seen immense buying from whales on Thursday following core developers fixing April 30 as a tentative date for the Pectra upgrade to go live on mainnet.

Top 3 Price Prediction Bitcoin, Ethereum, Ripple: BTC stabilizes while ETH and XRP show weakness
Bitcoin (BTC) price stabilizes at around $87,000 on Friday, as its RSI indicates indecisiveness among traders.

Cronos, CRO, jumps as SEC drops investigation into Crypto.com
Cronos (CRO), the native token of crypto exchange Crypto.com, rallied more than 10% on Thursday after announcing that the Securities & Exchange Commission (SEC) has dropped its investigation into the company.

U.S. Government spotted moving 97 BTC and 884 ETH: Sell-off or Stockpile?
The U.S. government’s recent $10.23 million Bitcoin and Ethereum transfer has sparked speculation about potential liquidation or strategic accumulation under new policies.

Bitcoin: BTC stabilizes around $84,000 despite US SEC regularity clarity and Fed rate stability
Bitcoin price stabilizes around $84,000 at the time of writing on Friday after recovering nearly 2% so far this week. The recent announcement by the US SEC that Proof-of-Work mining rewards are not securities could boost BTC investors' confidence.

The Best brokers to trade EUR/USD
SPONSORED Discover the top brokers for trading EUR/USD in 2025. Our list features brokers with competitive spreads, fast execution, and powerful platforms. Whether you're a beginner or an expert, find the right partner to navigate the dynamic Forex market.