Ethereum price prediction: ETH risks materialising rejection with fade towards $1,075
- Ethereum price tried breaking above the 55-day SMA this week.
- ETH fades and could break down from this rally since the end of November.
- The importance of the weekly close will be critical, with any close below the 55-day SMA opening up the risk for an 18% decline into next week.

Ethereum (ETH) price had this week one good moment as it was able to rally substantially on the back of a lower US CPI print. Unfortunately, that good vibe faded quite rapidly as the US Federal Reserve issued warnings across the board during its rate statement that it would start hiking with smaller increments of 50 basis points and possibly would need to hike for far longer than what markets currently are anticipating. This dislocation between the US Federal Reserve's valuation of the current situation and the current market conditions means that something has got to give. Usually, that means more downside to come.
ETH will undergo pain as the markets are too cheerful
Ethereum price is thus deciding on its fate if it closes this week below that 55-day Simple Moving Average (SMA). Although the 55-day SMA is not a clean element with perfect tests and instead is quite chopped up, it acts as a sandbox that slows any sprint to the upside. This fits the narrative when traders are looking for that Christmas rally, but it gets stalled each time as profit-taking happens too early and quickly.
ETH could start to see a fade to the downside as the US Federal Reserve has triggered a bit of a depressive mood as it crushed some aspirations for a steep Christmas rally to salvage what appears to be an almost lost year in returns. ETH risks dipping further towards $1,075, which is the low of November. Once that level breaks, for example, with next week’s data points pointing to confirm that the US Federal Reserve has been saying to see a flirt with $1,000 as $883.60 is the only level nearby that could provide plenty of support to stop the dip.
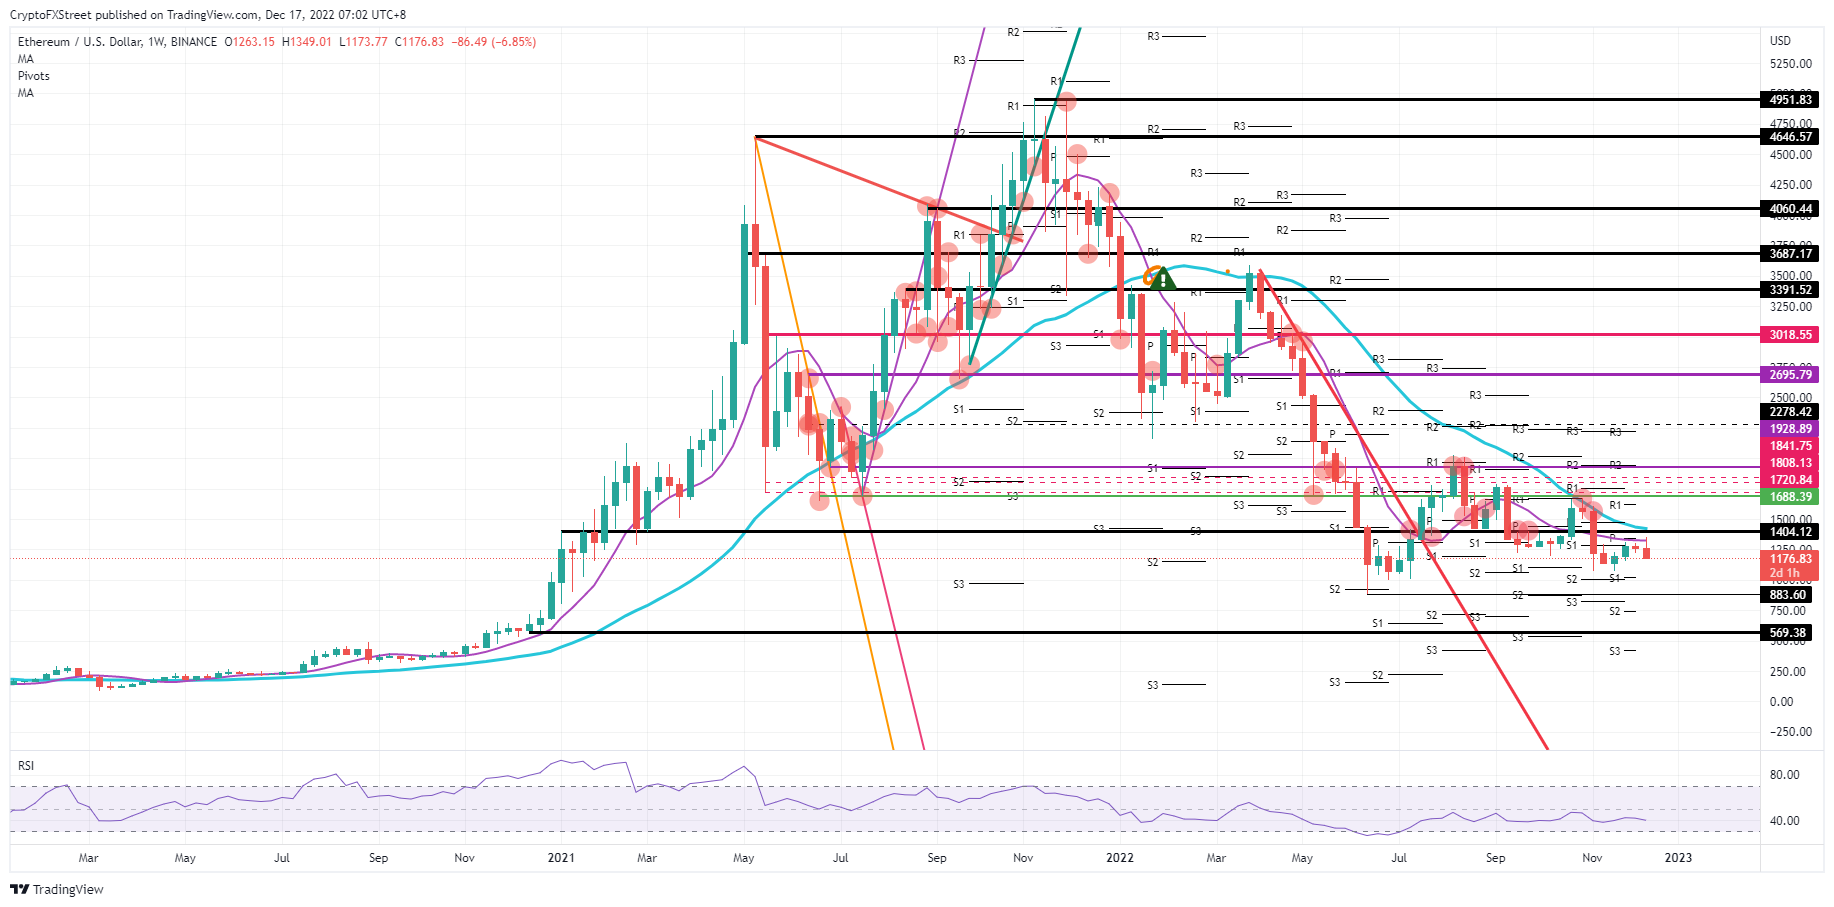
ETH/USD daily chart
Upside surprise would be a simple weekly close above the 55-day SMA, around $1,350. That would position bulls between the vacuum space between the 55-day SMA and the 200-day SMA to the upside; THat 200-day SMA is a force to be reckoned with as it already triggered twice in a row a firm rejection. Should traders ignore red lights from the central banks, expect to see price action piercing through $1,404 and tie up with gains around $1,688, bearing 35% towards the last two weeks of 2022.
Author

Filip Lagaart
FXStreet
Filip Lagaart is a former sales/trader with over 15 years of financial markets expertise under its belt.



