Top 3 Price Prediction Bitcoin, Ethereum, Ripple: Is this the calm before the storm?
- Bitcoin price endures a steep profit-taking frenzy.
- Ethereum price is testing lower levels of support after a 7% rally on the week.
- XRP price is down 8% on the month and 55% on the year.

The crypto market has early bulls in the market taking a profit. Despite this fact, there is a possibility for more upside. Key levels have been defined to determine the top 3 crypto's next potential move.
Bitcoin price retests resistance
Bitcoin price is undergoing a steep profit-taking consolidation following the bull's 8% rally on the week. On December 15, the peer-to-peer digital currency was down 2% on the day as the bears are prompting a breach of the 8-day exponential moving average. Although the BTC price has room to fall, there is still potential for Bitcoin to tackle higher targets.
Bitcoin price currently auctions at $17,784. The next bearish targets lie at the previous triangle apex zone near $17,085. Traders should be cautious with early entry. A daily close beneath the apex would spell bad news for the BTC price. So long as Bitcoin can consolidate above $17,085 on the larger time frames, a second attempt to hurdle $18,245 would likely occur.
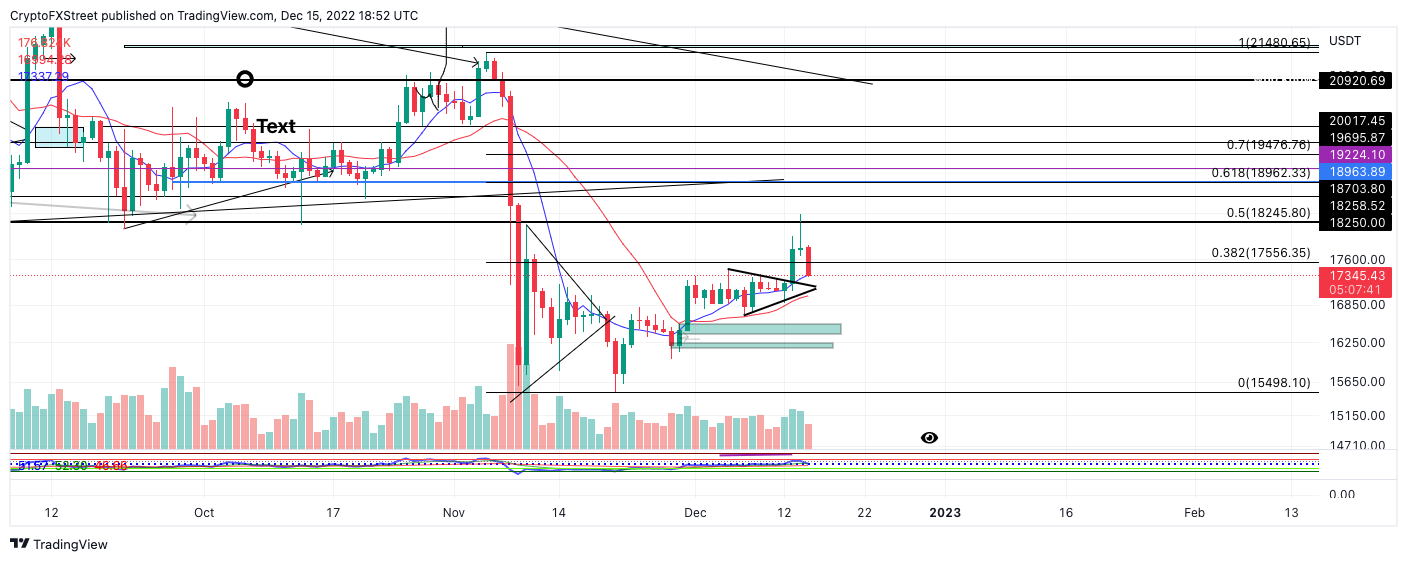
BTC/USDT 1-Day Chart
To recap, the bullish trend's invalidation point is a daily closing candlestick beneath $17,085. If the bears succeed, a downtrend move targeting the yearly low at $15,476 would be a justifiable trade idea. BTC would decline by 9% if said price action occurred.
Ethereum price retests the trend
Ethereum price is moving along with Bitcoin's price action as the decentralized smart-contract token is down 3.5% on the day. Earlier in the week, the ETH price produced a 7% spike, causing some investors to take profit quickly. At the time of writing, ETH is retesting the recently established trend line, which provided support on November 28, December 7 and December 12.
Ethereum price currently auctions at $1,317. Many classical price action traders consider the fourth test of any trend line to be the catalyst of a market reversal. While the trendline theory holds in many markets, being an early seller would be ill-advised. A closing candlestick beneath the $1,230 swing lows would suffice as a bearish entry point to liquidate the November lows at $1,075. The ETH price would decline by 15% under the bearish scenario.
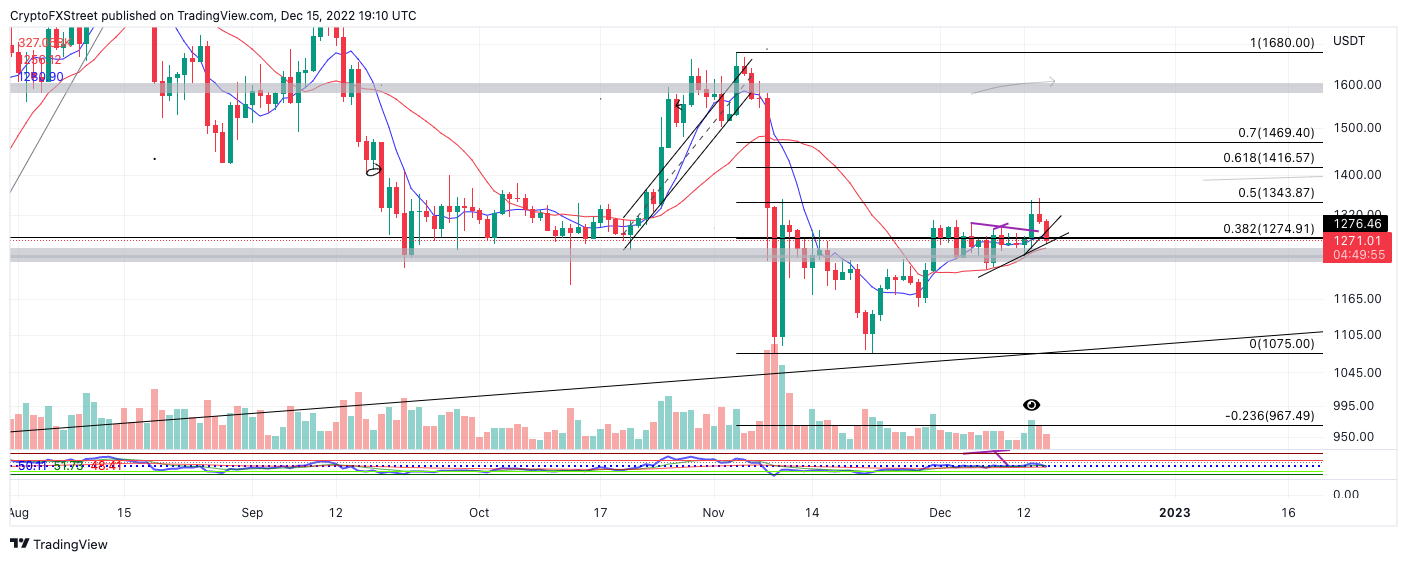
ETH/USDT 1-Day Chart
Traders should remember that this week's 7% rally enabled the bulls to reconquer October's previous support zone. The supportive barrier was crucial in ETH's 30% uptrend rally throughout October into early November. So long as the level above holds on higher time frames, ETH could still climb towards the mid $1,400, as mentioned in previous outlooks this month.
XRP price showing signs of trouble
XRP price is witnessing a slow grinding price action in the bear's favor. On the week, the digital remittance token is down 1% from the prior, as the market has provided minimal opportunities for grandiose swing trades. Nonetheless, the minute weekly decline still plays a role in the larger narrative. XRP price remains 8% lower than December's opening candlestick, bringing the yearly decline to 55%.
XRP price currently auctions at $0.379. The southbound price action seems coherent as the bears produced a classical Evening Star pattern on December 14. Utilizing the final candle within the 3-day bearish pattern can project the next target zone in the mid $0.36 zone. Ultimately, the volume indicator shows significant liquidity under the November 21 swing low at $0.345. Ripple will decline by 9% if the bears succeed in their liquidation attempt.
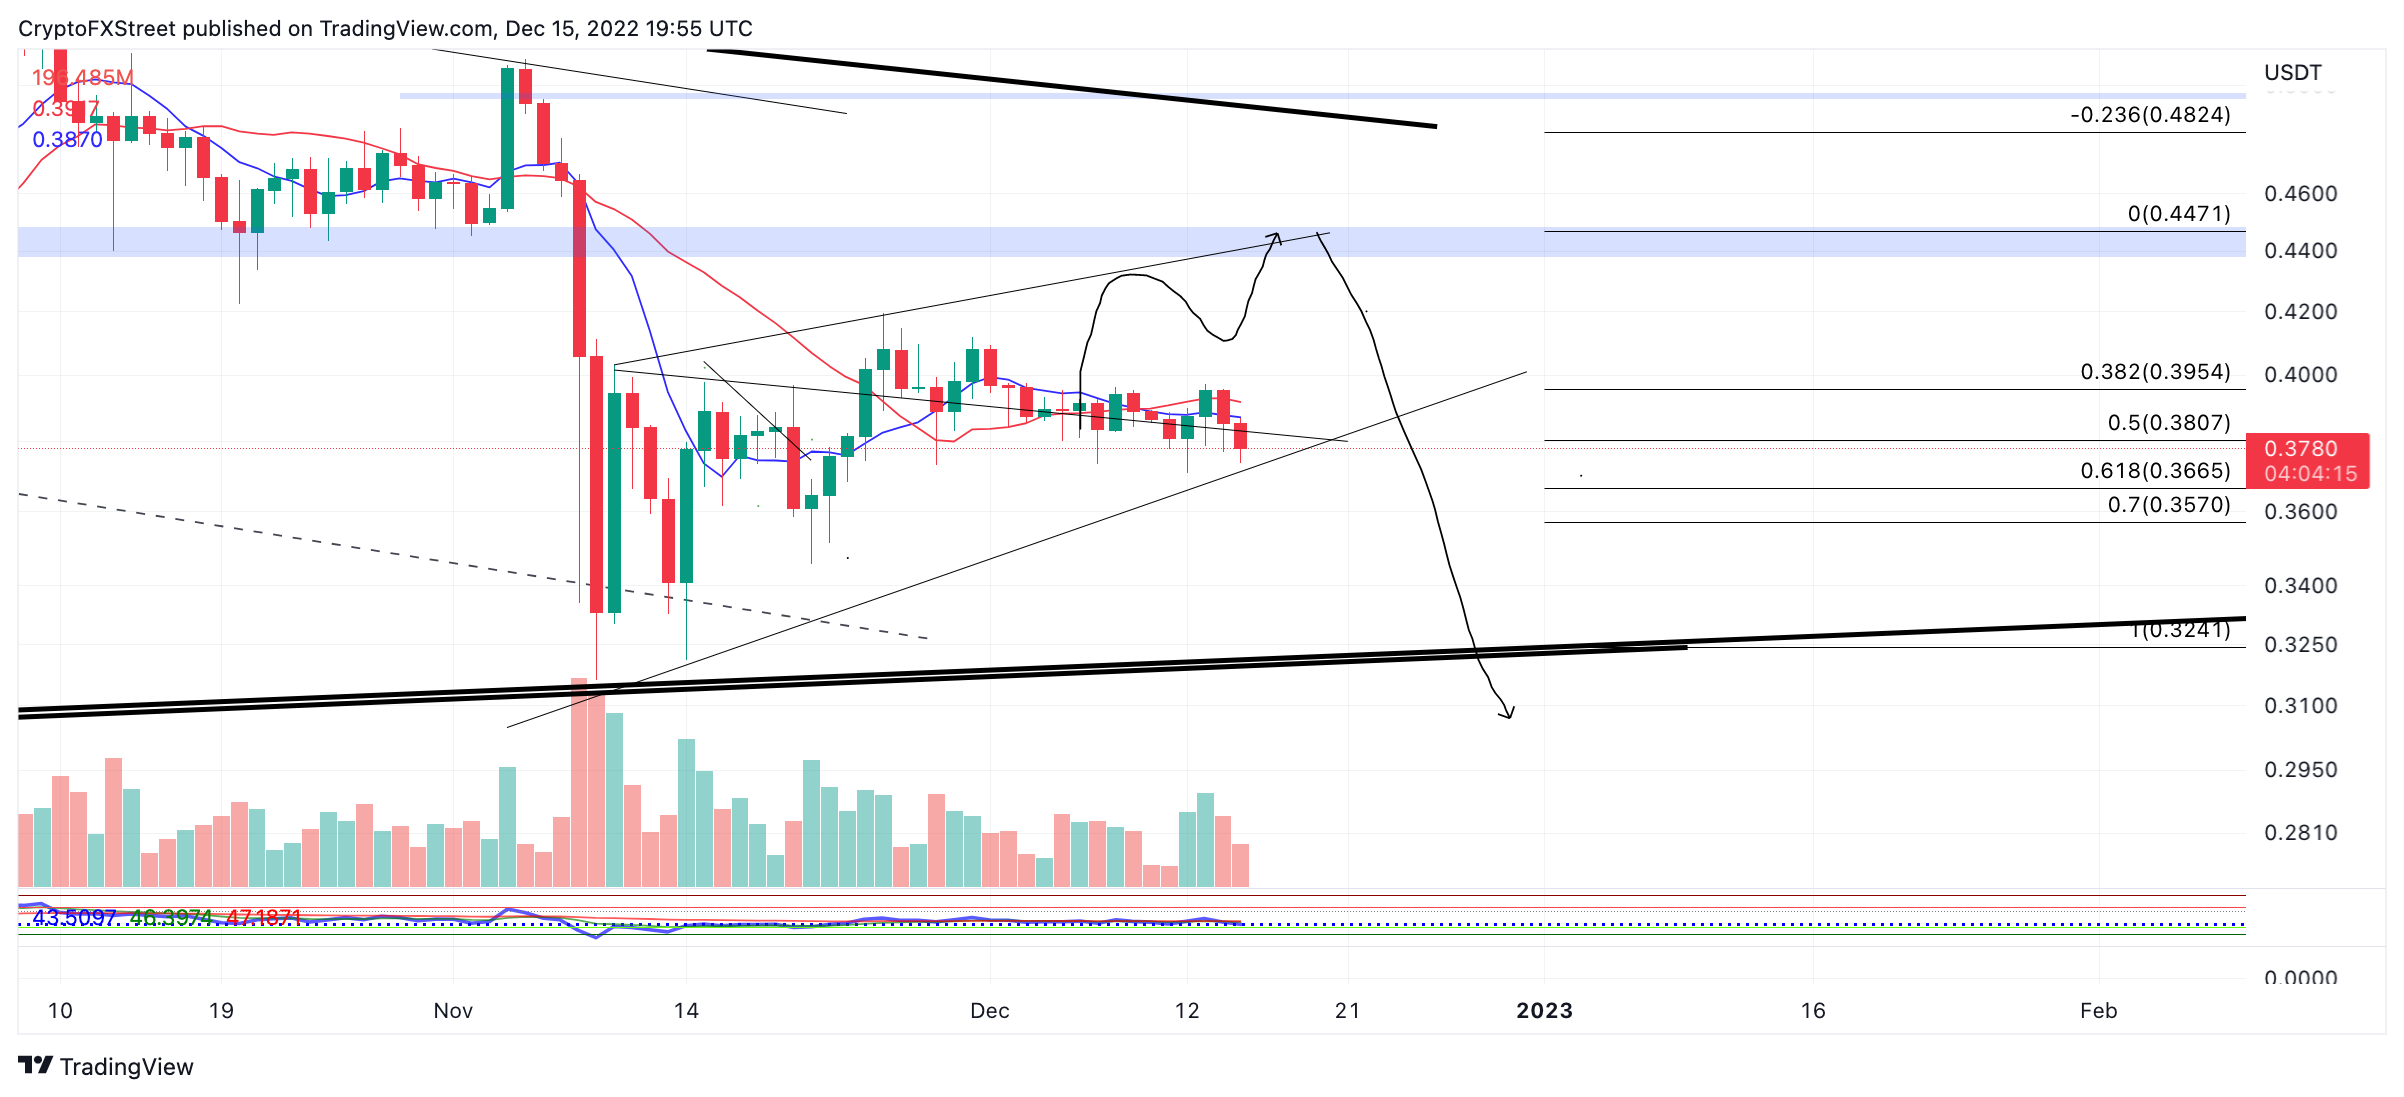
XRP/USDT 1-Day Chart
Based on the factors mentioned above, a bearish trend seems justifiable. Early signs of a reversal would be a breach above the 21-day simple moving average, currently positioned at $0.395. If the bulls can hurdle the indicator, a rally toward October's broken support zone at $0.44 would be on the cards. XRP price will rise by 16% if the bullish scenario plays out.
Author

Tony M.
FXStreet Contributor
Tony Montpeirous began investing in cryptocurrencies in 2017. His trading style incorporates Elliot Wave, Auction Market Theory, Fibonacci and price action as the cornerstone of his technical analysis.


