Algorand Price Analysis: ALGO ready to rock 52%, move to new record highs
- Algorand has made a technical breakout above a bull flag on the 4-hour chart.
- The 4-hour 50 SMA immediate support adds credibility to the bullish outlook.
- The SuperTrend indicator recently flipped bearish, suggesting that selling pressure will continue.

Algorand is making a remarkable recovery after finding support at $1.15. The previous bearish outlook came into the picture during the weekend session. As predicted, ALGO extended the down leg to $1.15 before the bulls regained control.
Algorand bull flag breakout eyes new all-time highs
A bull flag pattern is a bullish continuation formed after an asset has experienced a considerable upswing in price. The price increase slows down as buyers lose momentum, leading to a correction. However, the asset refuses to fall sharply, resulting in a consolidation period (flag).
The breakout from a bull flag has a target equal to the length of the pole. It is usually rapid and must be anticipated to make the most out of it. Similarly, it is essential to wait for a breakout confirmation before going all-in. Algorand is likely to rally 52% above the breakout point to trade new record highs at $2.
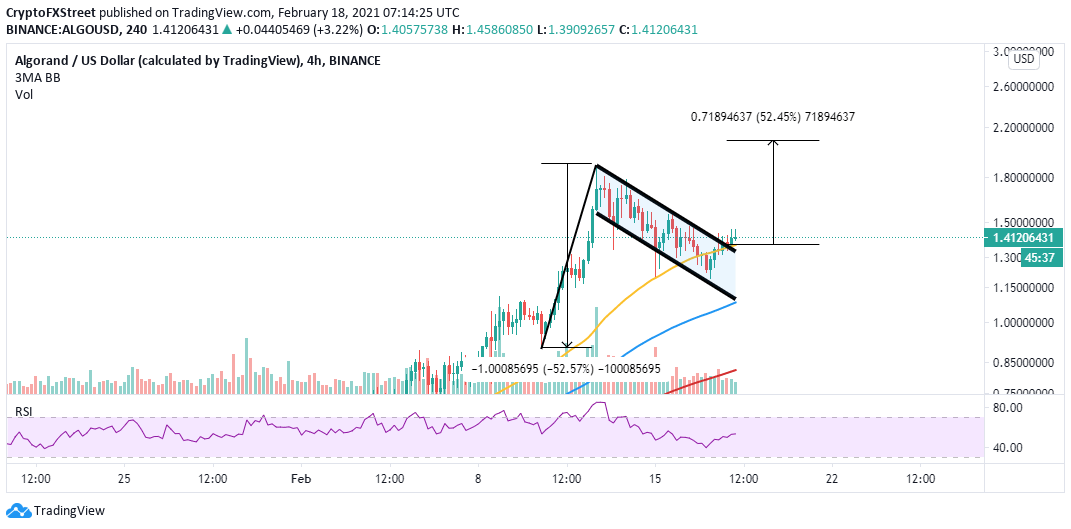
ALGO/USD 4-hour chart
The ongoing recovery was validated when the price stepped above the 50 Simple Moving Average on the 4-hour chart. Besides, the Relative Strength Index (RSI) has renewed its uptrend after dropping close to the oversold territory. Movement above the midline will signify an intensifying bullish grip.
Looking at the other side of the fence
The 4-hour SuperTrend Indicator recently gave a signal to short Algorand. In other words, the downtrend is far from over and the price may fall to lower levels. The SuperTrend indicator tracks the asset’s trend and identifies positions where a reversal is likely to occur.
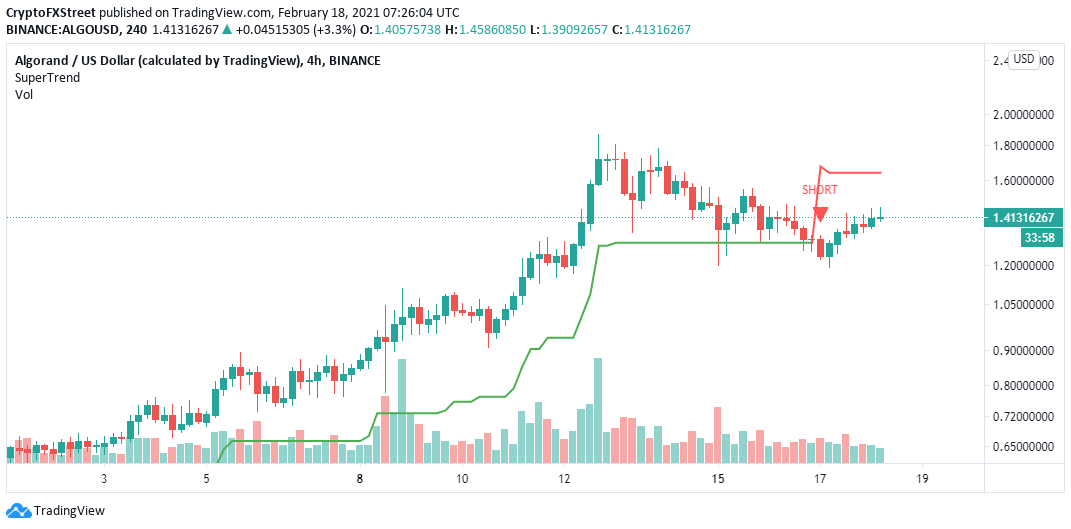
ALGO/USD 4-hour chart
For now, the trend has a bearish potential, according to the SuperTrend indicator. Unless the bull flag pattern is strong enough, recovery will be an uphill task. Therefore, ALGO could retest support at $1.15 and another at $0.95 before a significant uptrend comes into play.
Author

John Isige
FXStreet
John Isige is a seasoned cryptocurrency journalist and markets analyst committed to delivering high-quality, actionable insights tailored to traders, investors, and crypto enthusiasts. He enjoys deep dives into emerging Web3 tren


