Algorand price could slip towards $1 but eyes up potential bounce first
- Algorand price is contained inside a descending wedge pattern on the 4-hour chart.
- A key indicator has presented a sell signal on the daily chart.
- In the short-term, ALGO can see a nice rebound towards $1.7.

Algorand price had a massive rally towards $1.84 since November 2020 without any significant pullbacks. A key indicator has now presented a sell signal that could quickly push ALGO down to a new low, considering its overextension.
Algorand price can dive towards $1 if this call is confirmed
On the daily chart, the TD Sequential indicator has presented a sell signal on February 15. Using the Fibonacci Retracement tool we can determine some potential price levels for ALGO.
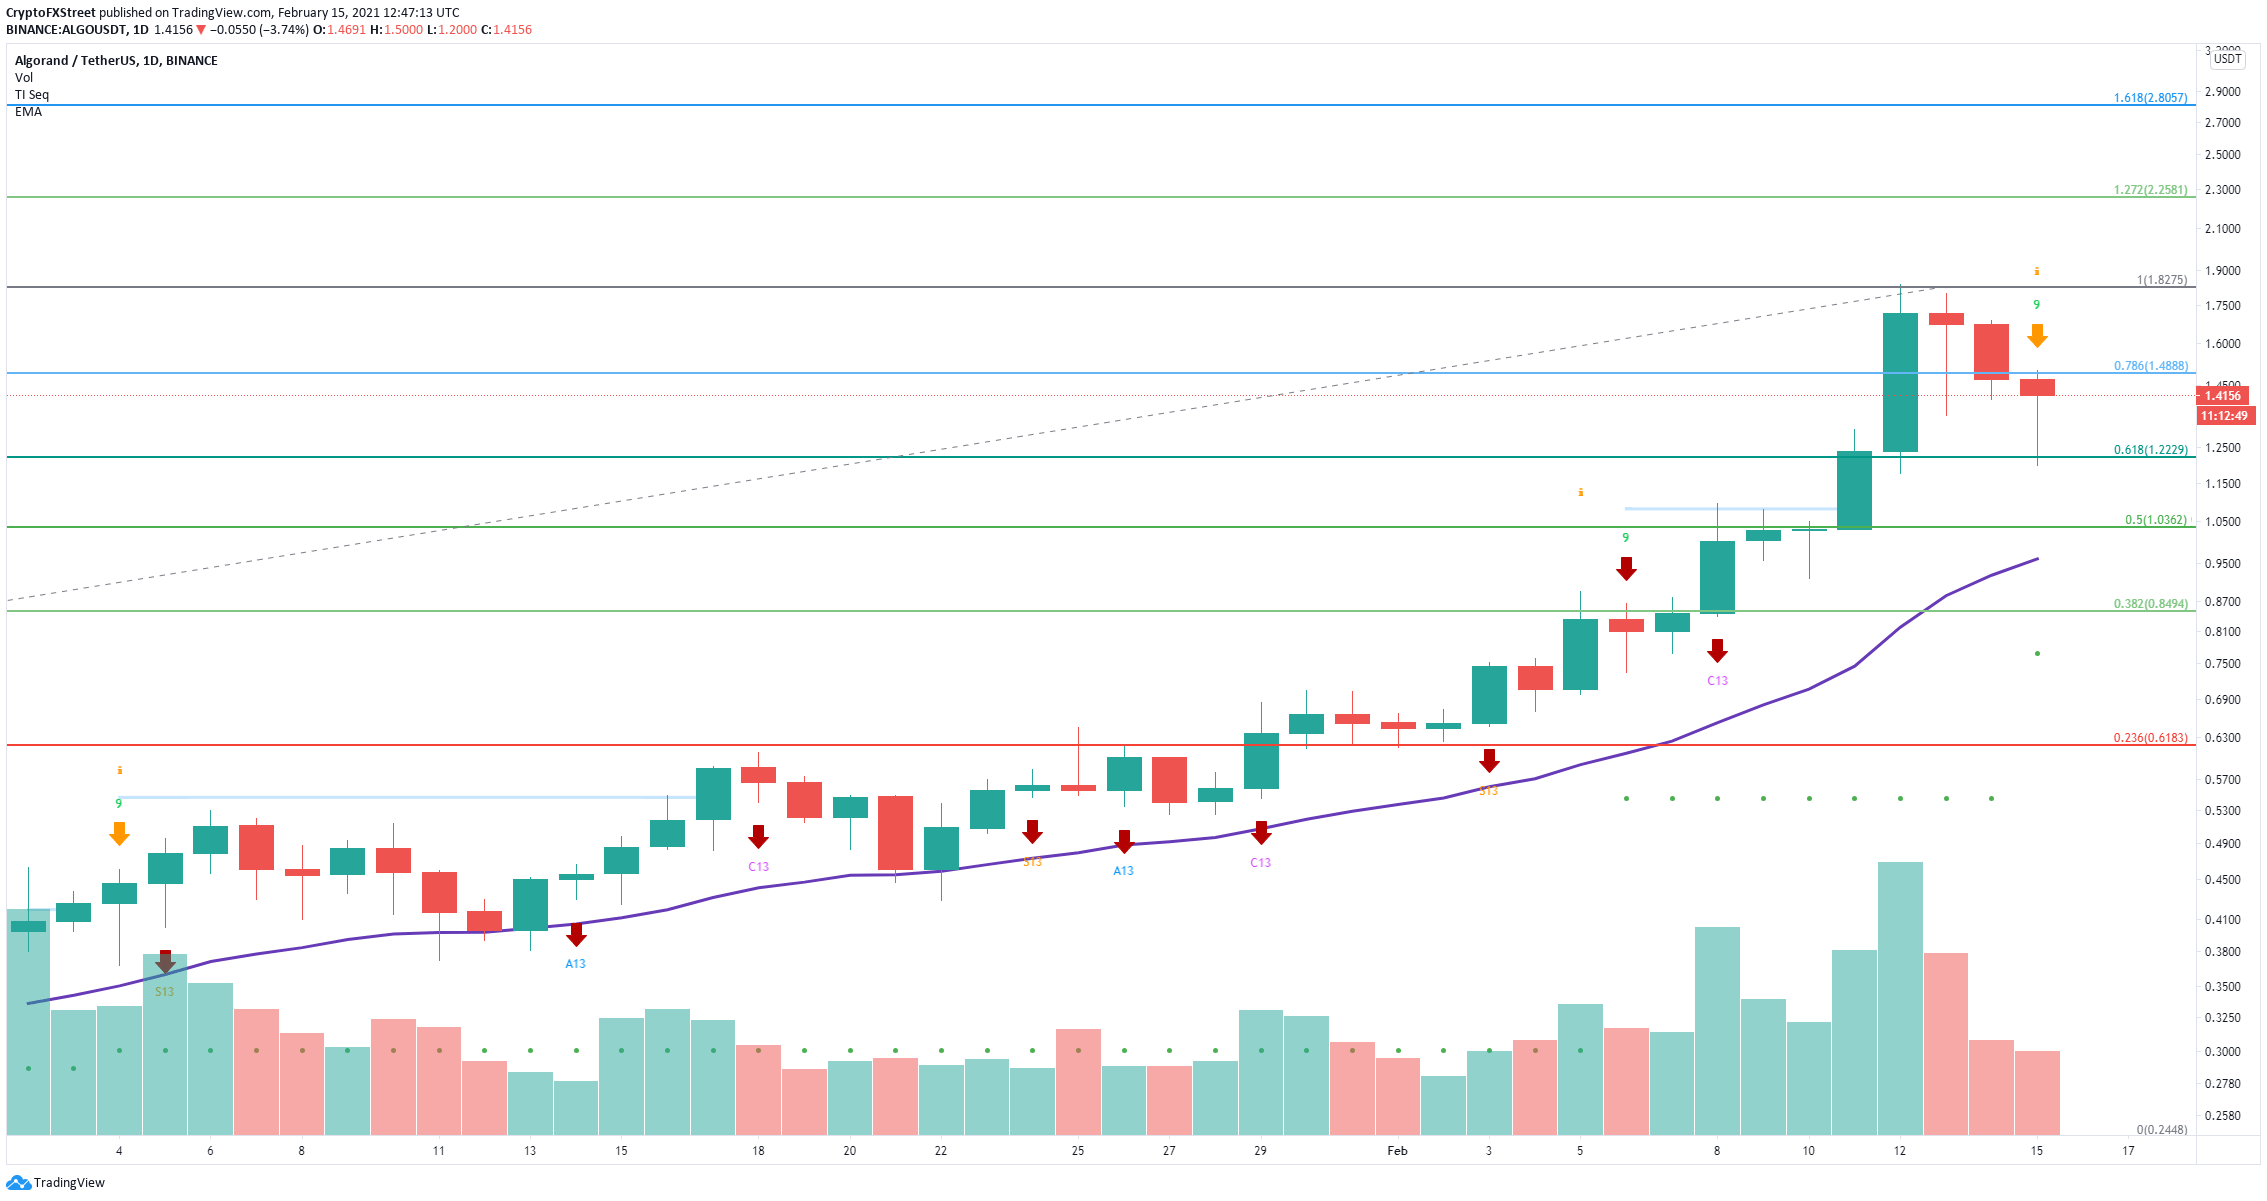
ALGO/USD daily chart
The digital asset has already touched $1.2 which was the 61.8% Fib level but can drop as low as $1 which is the 50% level and will coincide with the 26-EMA which is currently established at $0.96.
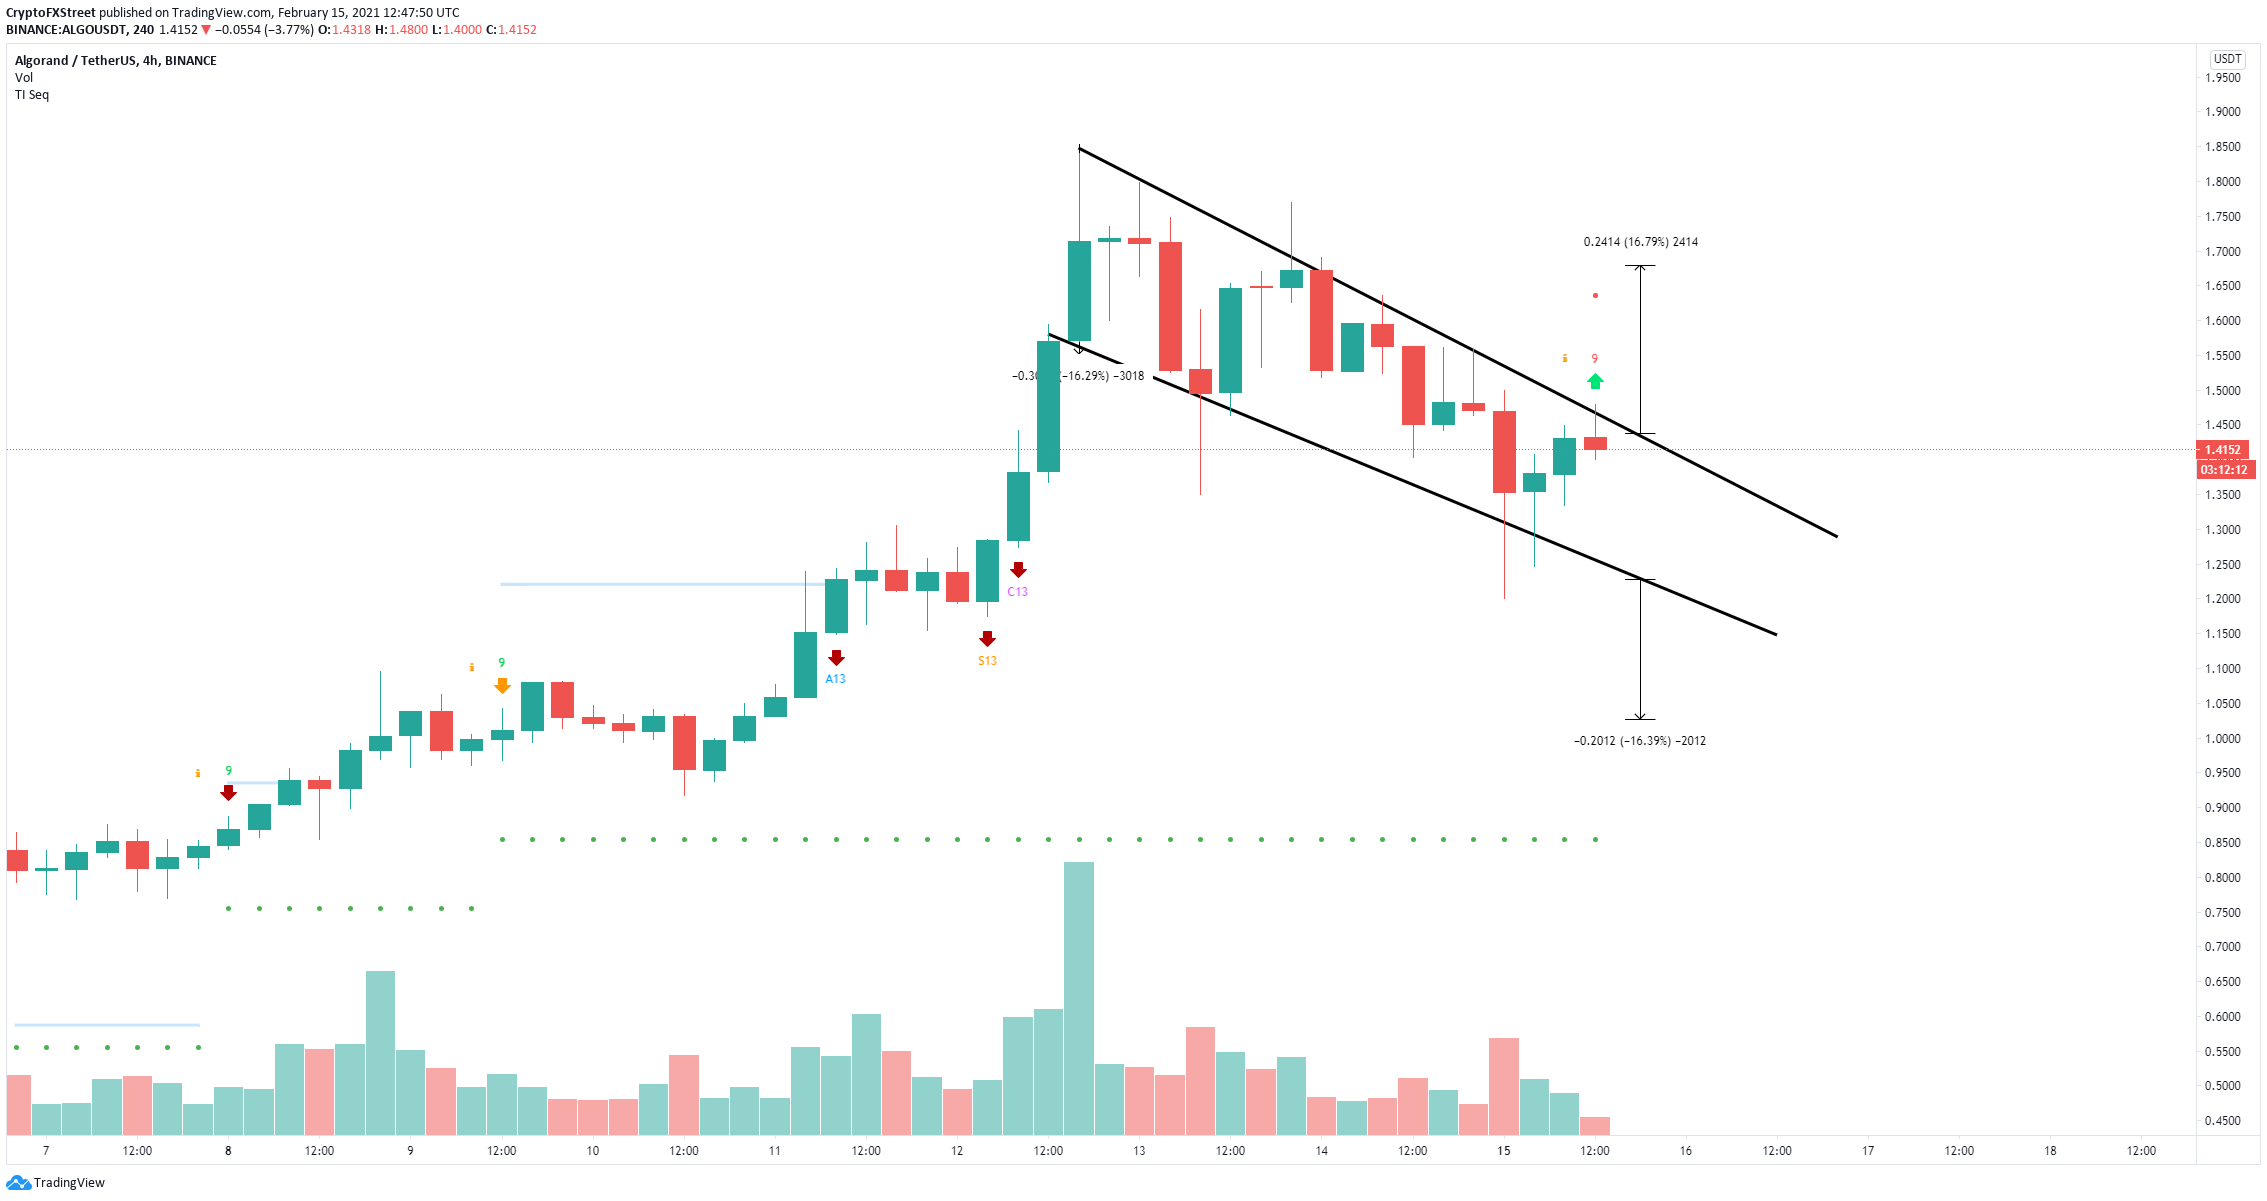
ALGO/USD 4-hour chart
On the 4-hour chart, Algorand has established a descending wedge pattern. Losing the key support level of $1.22 would push Algorand price to $1, which is the same bearish price target indicated by the Fibonacci tool.
However, the TD Sequential indicator has presented a buy signal here and the current Algorand price is closer to a breakout. Climbing above $1.44 would lead ALGO towards $1.7, a 16% breakout.
Author

Lorenzo Stroe
Independent Analyst
Lorenzo is an experienced Technical Analyst and Content Writer who has been working in the cryptocurrency industry since 2012. He also has a passion for trading.


