Algorand Price Forecast: ALGO makes a gigantic leap targeting $2.5
- Algorand fires up towards all-time highs after breaking above August 2020 resistance.
- The bullish outlook has been reinforced by the MACD.
- Algorand’s uptrend could reach exhaustion if the TD Sequential indicator flashes a sell signal.

Algorand continues to outperform, especially after spiking above 2020's high at $0.75. Trading above this crucial level has catapulted the token above our recent prediction of $1.05. Note that jumping past $1.55 (next key hurdle) will set the pace for gains towards $2.5.
Algorand bullish outlook is technically supported
The $1.6 billion altcoin is exchanging hands at $1.16 at the time of writing. These ongoing gains occurred after ALGO sliced through August 2020 resistance at $0.75. In addition to that, the bullish narrative has been validated by the Moving Average Convergence Divergence (MACD).
The MACD is a momentum oscillator utilized in trading trends but rarely used to identify overbought and oversold conditions. The indicator manifests on a chart with a couple of trendlines oscillating with no boundaries. Note that the crossover of these two lines is a trading signal resembling that of the moving average system.
It is essential to keep in mind that crossing above the midline (zero line) is regarded bullish, while crossing below the same line is bearish. Moreover, when the MACD line (blue) crosses above the signal line, it is bullish. On the other hand, the trend tends to flip bearish when the MACD line crosses under the signal line.
In the case of Algorand, the trend is currently bullish and likely to remain so until the MACD line crosses below the signal line. As mentioned, trading above $1.55 would boost the token's value toward $2.5. The remaining journey to all-time highs will depend on ALGO's ability to hold above higher support.
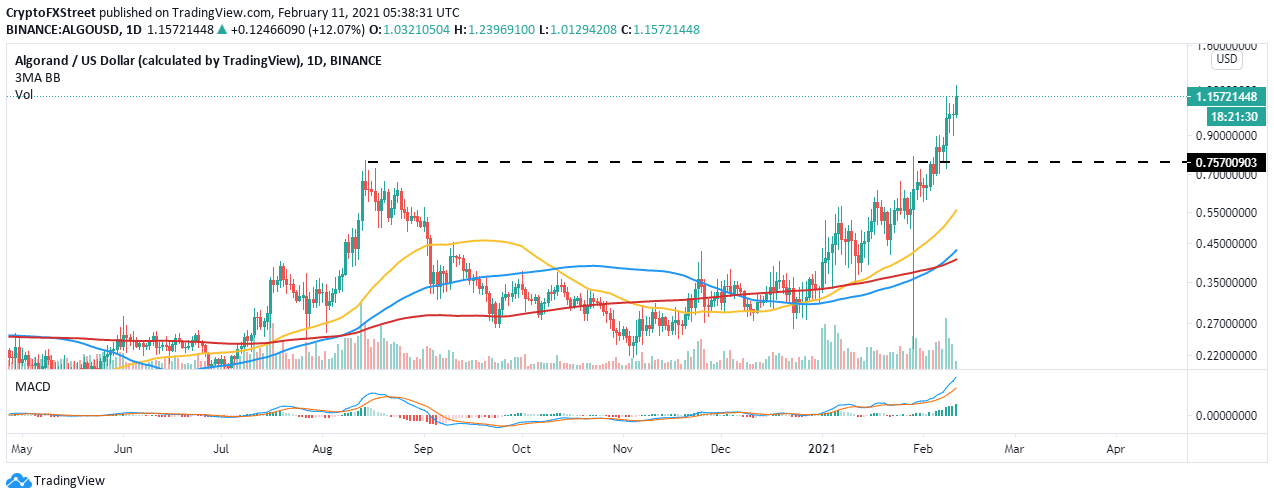
ALGO/USD daily chart
A comprehensive look at the daily chart reveals the formation of a golden cross. The pattern occurs when a shorter-term moving average crosses above a longer-term moving average. For instance, the 100 Simple Moving Average has just crossed above the 200 SMA, cementing the bulls' presence in the market.
Looking at the other side of the picture
The TD Sequential indicator, which can be used in identifying the positions where an asset's uptrend or downtrend exhausts itself, is likely to present a sell signal on the 12-hour chart. This indicator is useful when looking for price points where one can buy or sell.
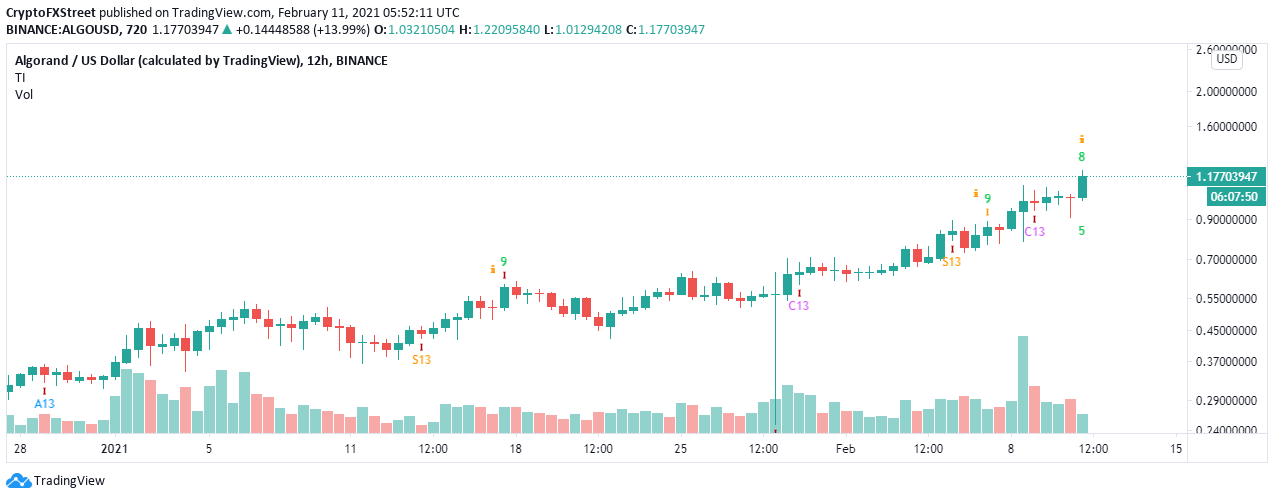
ALGO/USD 12-hour chart
A sell signal comes in a green nine candlestick. It is validated when its low closes the day above the lows of the sixth and seventh candles. Therefore, Algorand's uptrend could be nearing its elastic limit, which might see a correction come into the picture. Note that support will be provided at $0.75 and the 50 SMA, currently holding the ground at $0.55 on the 12-hour chart.
Author

John Isige
FXStreet
John Isige is a seasoned cryptocurrency journalist and markets analyst committed to delivering high-quality, actionable insights tailored to traders, investors, and crypto enthusiasts. He enjoys deep dives into emerging Web3 tren


