USD/INR Price Forecast 2020: Domestic factors barely support a turnaround for Indian rupee
- Easing monetary policy from RBI keeps limiting INR's bulls prospects.
- USD/INR price has also capped upside on a relatively softer US dollar.
- Indian rupee forecast will be determined by the resolution of the current tight trading range between 70.50 and 72.00.

After falling nearly 9% in 2018, the Indian rupee (INR) fell another 4% and touched a 2019 low level of 72.40 against its American counterpart on September 3 in the wake of the tit-for-tat trade war between the world's two largest economies. It has since then recovered a part of the yearly losses amid signs of progress in the US-China trade dispute and a tentative improvement in the global economic outlook.
Adding to this, renewed interest among foreign portfolio investors for Indian assets, as depicted by stable portfolio flows, has also led to the recent bounce. According to the latest data, foreign portfolio investors had bought 160.69 billion rupees of Indian securities in October, the highest in six months. The purchases pushed the rupee to levels over one-month highs, dragging the USD/INR cross further below the 71.00 mark during the first half of December.
RBI acting as a headwind for USD/INR price
However, the fact that the Reserve Bank of India (RBI) is mopping up dollars inflows might limit any further appreciation. According to estimates by Bloomberg Economics, the RBI has bought about $18 billion of foreign exchange since the end of September and propelled reserves to a record, pointing to determined efforts to curb a sharp appreciation of the domestic currency, which can hurt exports. The RBI’s sharp dollar purchases could be seen as a predominant reason behind the rupee's under-performance in emerging Asia. Recently, the RBI Governor Shaktikanta Das also indicated the tolerance for a weaker rupee and said that the currency is fairly valued.
Growth risks weighing on the currency’s outlook
Apart from the RBI’s deliberate effort, market participants also think that the currency market is under-pricing downside risks to domestic growth. The Indian economic growth slowed to a six-and-a-half-year low level of 4.5% during the July-September quarter. The recent business surveys continued to indicate sluggishness, suggesting that growth could decelerate further and any recovery will be slow. A slew of interest rate cuts from the Reserve Bank of India (RBI) has done nothing concrete so far to revive a slowing Indian economy.
With five reductions in succession for a cumulative of 135 basis points, the RBI has been one of the most aggressive central banks in the world for 2019. However, the impaired balance sheets of many public sector banks and NBFCs have diluted the flow through the real economy and might further delay the effects of monetary easing. Adding to persistent concerns about the slowing domestic economy, the risk of fiscal slippage might further prevent the currency from recouping this year's losses against the dollar in 2020.
India’s worrying fiscal deficit to put additional pressure
The stimulus measures introduced this year have made it difficult for Prime Minister Narendra Modi's government to meet its fiscal deficit targets. It is worth mentioning that the government on September 20 announced tax cuts for corporates, bringing down the effective tax rate by 10-12% to 25.2%. The lower rate was applicable from April 1, 2019 and is expected to trigger a revenue loss of INR 1.45 trillion in the current fiscal year. However, if the measures taken by the government do not result in improving the growth outlook, a reversal of portfolio flows could actually lead to some renewed weakness for the rupee.
Softer dollar might limit rupee’s downside
Meanwhile, a modestly weaker US dollar may limit rupee's downside. Growing expectations for a resolution to the US-China trade war led to a global stock market rally in recent weeks. A wave of interest-rate cuts from the world’s central banks has also helped to boost risk assets and the greenback, in turn, gave back some of its gains. Coinciding with investor optimism, the US economic growth – after the fiscal-fuelled boom of 2018 – has started to decelerate and most leading indicators of activity have been heading lower or are already in the contraction territory, suggesting that the USD uptrend has nearly run its course.
A slowdown in the US combined with falling inflation might prompt the Federal Reserve to provide support to the economy by cutting interest rates further, and even restart its quantitative easing program. As the rule-of-thumb goes, lower interest rates and renewed bond purchases will weigh on the greenback, something that feeds into the expectations that a top in the recent rally has already been reached. In fact, the Fed has cut rates three times in 2019 to counter recession fears, though signaled an indefinite pause at its latest meeting on December 11.
According to the central bank's updated quarterly economic projections, policymakers now anticipated no rate change in 2020. Officials penciled in only one move in 2021, a rate-hike, and another in 2022. Meanwhile, in the post-meeting press conference, the Fed Chair Jerome Powell said that he doesn't think rates need to rise anytime soon until inflation grows persistently. Given that the record-long US economic expansion is in its 11th year, the Fed's favorable outlook calmed concerns that the economy could falter and might result into only a modest depreciation for the greenback in 2020.
USD/INR technical set-up
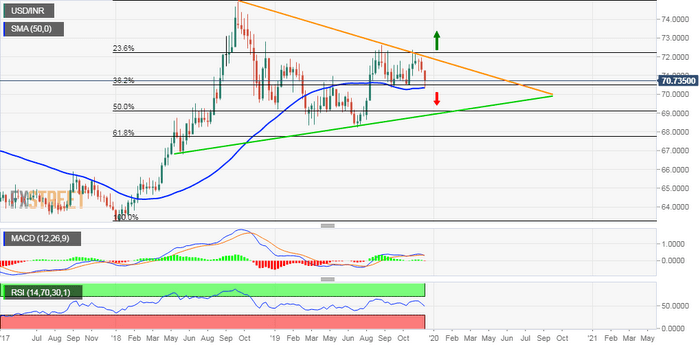
The USD/INR pair has been oscillating well within a broader trading range since early August 2019. The 38.2% Fibonacci level of the 63.27-74.96 move up, around the 70.50-40 region, has been acting as important support. The mentioned support coincides with 50-week SMA and should now act as a key pivotal point for short-term traders. A convincing breakthrough should pave the way for a further near-term depreciating move towards challenging confluence support near the 69.00 round-figure mark.
Meanwhile, the attempted positive moves had been facing stiff resistance near the 72.20 confluence region, comprising of 23.6% Fibonacci level of the 63.27-74.96 move up and a descending trend-line. A sustained breakthrough the confluence barrier might worsen the outlook for the Indian rupee and lift the USD/INR cross towards the 73.00 handle. The momentum could further get extended towards 74.25-30 region before the cross eventually aims towards retesting 2018 swing highs, around the key 75.00 psychological mark.
Related 2020 Forecast Articles
EUR/USD: Lean times soon to turn into flush times for euro dollar
GBP/USD: Pound may continue to fall on hard Brexit deadline
USD/JPY: A journey from trade fears to high-stakes elections
AUD/USD: May the aussie live in interesting times
USD/CAD: Canada and loonie are well positioned but not in control
Gold: XAU/USD bulls likely to remain in control
Crude Oil: WTI bulls to hold their horses despite tighter market, rosier economy
Bitcoin: BTC, the ultimate store of value
Ethereum: Calm on ETH/USD after the storm is over
Ripple's XRP: The glimpse of hope
Author

Haresh Menghani
FXStreet
Haresh Menghani is a detail-oriented professional with 10+ years of extensive experience in analysing the global financial markets.


