AUD/USD Price Forecast 2020: May the aussie live in interesting times
- RBA to keep cutting rates, while the Fed is expected to stay put.
- Easing tensions between the US and China are a relief for the Australian economy.
- AUD/USD giving some modest signs of bottoming, but far away from entering bullish territory.
- AUD/USD Forecast Poll shows a modest bullish bias for the aussie.

It’s a well-known fact that when China sneezes, Australia gets a cold. The commodity-producer country depends on its Asian neighbor to keep its economy alive, as most of its exports end up being shipped to China.
The trade war between Beijing and Washington took its toll on the Australian economy, hence in AUD/USD, which fell in October to a one-decade low of 0.6670 back in October. Quite a slump considering the pair topped at 0.8135 in January 2018, shortly before the trade war started. It is hard to tell whether the RBA was more concerned – back then, or now. Indeed, policymakers needed the Aussie to be cheaper, but not at the cost they finally had to pay.
AUD/USD news: Australian economy still in trouble
The Australian economy grew a seasonally adjusted 0.4% in the third quarter of 2019 – below the 0.6% of Q2 and missing the market’s expectation. Throughout the three months leading to September, government spending eased and household consumption expanded at its weakest pace since the global financial crisis. The annual rate of growth stands at 1.7% according to the latest available data.
The employment sector in the country is far from healthy and that has actually been the catalyst that pushed the RBA to cut rates to a record low of 0.75%. More rate cuts are in the docket for 2020, which means that AUD/USD may not have yet seen a bottom. Sluggish wages’ growth has been a drag since December 2013, entrenched to a 2%-3% range, one point below the previous decade’s average. In fact, according to the latest data, wages’ growth is closer to the lower end of the range than to the top of it, in spite of the three rate cuts the RBA delivered this year.
The central bank’s efforts are giving shy signs of working but it is still way too early to say. Rather, the market is waiting for additional easing, which means that aussie traders are reading that the economic downturn is not yet over.
“The easing of monetary policy this year is supporting employment and income growth in Australia and a return of inflation to the medium-term target range,” said RBA´s Governor Philip Lowe earlier this December. The RBA Minutes of the latest meeting, however, showed that policymakers acknowledged low consumption levels and hinted that a possible rate cut could be coming in their next meeting in February.
Hopes in the trade war front
Ever since the US announced it will investigate applying tariffs on Chinese goods back in March 2018, the world has rotated around tensions between those two countries. It took them almost two years to come to the beginning of an agreement. Both economies announced this December that phase one of a trade deal is underway, with President Trump announcing it will be signed “very shortly.”
The news fell short of keeping the market’s sentiment boosted, but when combined with the latest US growth data, it was more than enough to boost Wall Street to all-time highs. The latter development is underpinning the pair, alongside with trade-tensions relief. Would it last? For now, it seems the answer will be a "yes", although it all depends on Trump.
Speaking of which, the US will head to the polls in November 2020. Trump’s leadership will be challenged and so will his policies. It’s way too early to say how it will end, but for sure it will result in a shaky end of the year.
Growth taking center stage
As I mentioned at the start of this article, the Australian economy is tied to the Chinese one. The more progress in the US-China trade relationship, the bigger the chances of better economic developments in the commodity-linked country. It's worth mentioning, however, that the US economy has been the cleanest shirt in the dirty laundry pile. The annualized US Gross Domestic Product was reported at 2.1% in Q3, way beyond that of all its major counterparts.
With that in mind, and considering that the RBA is planning to keep easing while the US Federal Reserve has clearly announced a pause, it seems that the United States and the American dollar will outperform their Australian counterparts, with the aussie keeping its bearish bias.
AUD/USD Technical Outlook
-637127150494882140.png)
The AUD/USD pair has broken above a long-term descendant trend line coming from 0.8135, January 2018's monthly high, as recent as the current month of December, having entered a consolidative phase afterward.
The pair has spent the last four months consolidating in a 300 pips’ range and the monthly chart shows that bears retain control. The 20 SMA keeps heading south, currently providing relevant resistance at around 0.7065, while the 100 SMA is about to cross below the 200 SMA far above the current level. Technical indicators have recovered modestly but remain below their midlines, falling short of signaling a steeper recovery.
On a weekly basis, there are some modest signs of bullish pressure. Not only the pair has advanced beyond the mentioned trend line, but also above its 20 SMA. The Momentum indicator advances within positive levels, at its highest since January 2019, while the RSI consolidates at around 53. The 100 SMA, however, maintains its bearish slope well above the current level, and below the 200 SMA.
The 0.7000 figure is the immediate relevant resistance, ahead of the 0.7200 price zone. The pair would turn bullish once above this last, with 0.7440 as a possible bullish target.
The risk will turn south on a break below 0.6830, while below 0.6670, the pair has room to extend its slump to 0.6606, where it bottomed in October 2008.
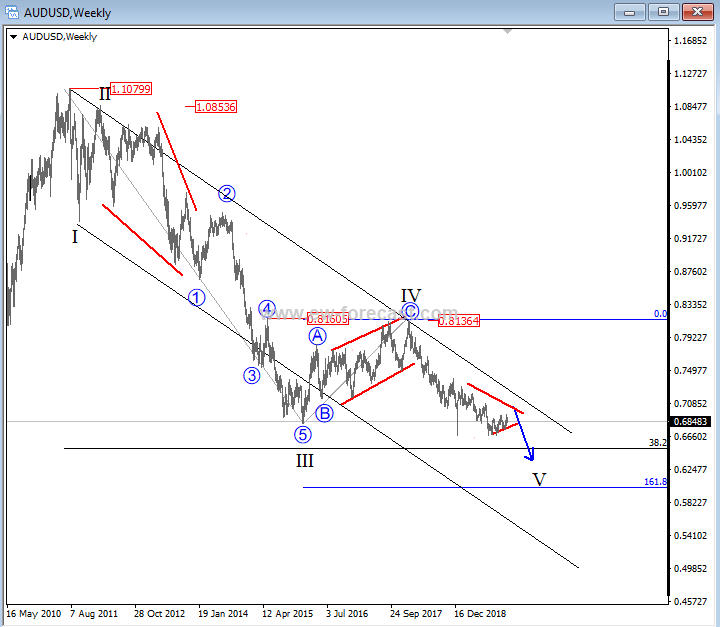
Gregor Horvat projects a bearish outlook for the aussie on his Elliott Wave analysis:
AUD/USD Elliot Wave Analysis

As we expected for 2019, even AUDUSD is coming nicely lower into our projected 0.6500 – 0.6000 target area for wave V that can still take some time, at least in the 1st quarter or half of 2020, before a major reversal may show up.
Forecast Poll 2020
| Forecast | H1 - Jun 30th | H2 - Dec 31st |
|---|---|---|
| Bullish | 57.5% | 59.0% |
| Bearish | 30.0% | 35.9% |
| Sideways | 12.5% | 5.1% |
| Average Forecast Price | 0.6969 | 0.7000 |
| EXPERTS | H1 - Jun 30th | H2 - Dec 31st |
|---|---|---|
| Alexander Douedari | 0.7000 Bullish | 0.7300 Bullish |
| Andrew Lockwood | 0.6600 Bearish | 0.6350 Bearish |
| Andrew Pancholi | 0.6640 Bearish | 0.6788 Sideways |
| ANZ FX Strategy Team | 0.6600 Bearish | 0.6600 Bearish |
| BBVA Bancomer Team | 0.7200 Bullish | 0.7500 Bullish |
| BoA FX, Rates and Commodities Team | 0.7000 Bullish | 0.7200 Bullish |
| Brad Alexander | 0.7150 Bullish | 0.7300 Bullish |
| Chris Svorcik | 0.7300 Bullish | 0.8000 Bullish |
| Chris Weston | 0.6850 Sideways | 0.6500 Bearish |
| Christina Parthenidou | 0.7030 Bullish | 0.6900 Sideways |
| CIBC World Markets Team | 0.7200 Bullish | 0.7500 Bullish |
| CitiFX | 0.7000 Bullish | 0.7100 Bullish |
| Danske Research Team | 0.7000 Bullish | 0.7000 Bullish |
| Dmitriy Gurkovskiy | 0.7500 Bullish | 0.6300 Bearish |
| Dukascopy Bank Team | 0.6700 Bearish | 0.6300 Bearish |
| Eagle FX Team | 0.7500 Bullish | 0.6300 Bearish |
| ForexGDP Team | 0.6400 Bearish | 0.7000 Bullish |
| FX Trading Revolution Team | 0.6600 Bearish | 0.7000 Bullish |
| Goldman Sachs Global Investment Team | 0.7000 Bullish | 0.7000 Bullish |
| Gregor Horvat | 0.6800 Sideways | 0.6500 Bearish |
| ING Global Economics Team | 0.7000 Bullish | 0.7200 Bullish |
| Ipek Ozkardeskaya | 0.7000 Bullish | 0.7200 Bullish |
| Jamie Saettele | 0.7000 Bullish | 0.7400 Bullish |
| Jeff Langin | 0.6600 Bearish | 0.6350 Bearish |
| Jose Blasco | 0.7100 Bullish | 0.7200 Bullish |
| NAB Global Market Research Team | 0.6900 Sideways | 0.7100 Bullish |
| National Bank of Canada Eco. & Strat. Team | 0.6900 Sideways | 0.6700 Bearish |
| Nenad Kerkez | 0.7184 Bullish | 0.7417 Bullish |
| OctaFx Analyst Team | 0.7200 Bullish | 0.7400 Bullish |
| Rabobank Financial Markets Research Team | 0.6600 Bearish | 0.6500 Bearish |
| RBC Economic Research Team | 0.6700 Bearish | 0.6600 Bearish |
| Societe Generale Analyst Team | 0.6900 Sideways | 0.7000 Bullish |
| Standard Bank Research Team | 0.7100 Bullish | 0.7200 Bullish |
| Stelios Kontogoulas | 0.7000 Bullish | 0.7200 Bullish |
| Stephen Innes | 0.7300 Bullish | 0.8000 Bullish |
| Tomasz Wisniewski | 0.7000 Bullish | 0.7100 Bullish |
| UniCredit Research Team | 0.6700 Bearish | 0.6500 Bearish |
| UOB Group Team | 0.7000 Bullish | - |
| Wells Fargo Research Team | 0.6600 Bearish | 0.6700 Bearish |
| Westpac Institutional Bank Team | 0.6700 Bearish | 0.6700 Bearish |
My moonshot of the year as I expect the global growth recovery story to really talk off in 2020 and China economy will prove to be more relient as they look inwards to insulate from global growth concerns.
1. The rate has declines sharply during the last two years. This decline was slowed down by a trend line. The trend line can be drawn by connecting the 12/2017 and 10/2018 low levels. 2. In the meantime, not that the 200-day SMA is the indicator, which has pushed the rate down since April 2018. Due to that, the way, how to work this pair, is rather easy, as breaking of the SMA would signal the end of the decline. 3. In addition, note that at the end of 2019 the 0.6690 level was providing support. The passing of this level could result in a sharp decline down. 4. All factors combined, the rate should trade sideways until one of the mentioned price levels is passed.
Related 2020 Forecast Articles
EUR/USD: Lean times soon to turn into flush times for euro dollar
GBP/USD: Pound may continue to fall on hard Brexit deadline
USD/JPY: A journey from trade fears to high-stakes elections
USD/CAD: Canada and loonie are well positioned but not in control
Gold: XAU/USD bulls likely to remain in control
Crude Oil: WTI bulls to hold their horses despite tighter market, rosier economy
USD/INR: Domestic factors barely support a turnaround for Indian rupee
Bitcoin: BTC, the ultimate store of value
Ethereum: Calm on ETH/USD after the storm is over
Ripple's XRP: The glimpse of hope
Author

Valeria Bednarik
FXStreet
Valeria Bednarik was born and lives in Buenos Aires, Argentina. Her passion for math and numbers pushed her into studying economics in her younger years.


