Gold Price Forecast 2020: XAU/USD bulls likely to remain in control
- Gold price has put on a good show in 2019 on dovish Fed, trade war and recession fears.
- Fed's willingness to allow inflation to run hot and balance sheet expansion could keep gold better bid in 2020.
- XAU/USD price technical charts are reporting a bullish continuation pattern.

Gold looks set to end the year with double-digit gains and is likely to maintain its upward trajectory in 2020.
At press time, the yellow metal is trading at $1477 per Oz, representing 15.25% gains on a year-to-date basis. Anything above 13.2% would be the biggest yearly gain since 2010 when prices had rallied by 29.6%.
Trade war, recession fears and dovish Fed pushed gold price higher in 2019
The year gone by will be remembered for the US-China trade war escalation, persistent recession fears and more importantly, for the US Federal Reserve’s remarkable dovish U-turn.
The Fed had raised rates by 25 basis points in December 2018 and penciled in two rate hikes for 2019. However, the central bank reversed course in the first quarter and officially confirmed rate hike pause.
The metal gained just 0.76% in the first quarter, as the rate hike pause was already priced in the last quarter of 2018, but picked up a strong bid and rose 9 percent in the April to June period with markets increasingly betting on rate cuts.
The Fed reduced borrowing costs by 25 basis points in July – the first rate cut since 2008 – and announced quarter-point reductions in September and October. As a result, gold eked out 4.48% gains in the third quarter.
Apart from the Fed’s dovish turn, the metal also drew haven bids, courtesy of the US-China trade war and the resulting fears of recession in the world’s two biggest economies.
Throughout the year, the pendulum of trade-related headlines kept swinging between extremes with both sides backtracking from positive comments several times. The resulting uncertainty and market volatility likely boded well for gold.
Meanwhile, the treasury yield curve, which had inverted (10s2s) in December 2018, kept recession talk alive throughout the year. Occasionally, the German economic slowdown also garnered attention from gold traders.
2020: Path of least resistance is to the higher side
Dovish Fed
The US central bank signaled rate cut pause for 2020 earlier this month. As a result, some observers are worried that next year could prove to be a difficult one for gold prices.
While the central bank has officially announced an end of the easing cycle, it is unlikely to start raising rates anytime soon. In fact, the Fed is willing to allow inflation to run hot and will consider raising rates only if inflation persistently remains above its target of 2%, Chairman Powell said on Dec. 11.
Put simply, the Fed is still tilting slightly toward a dovish stance and that will likely bode well for the yellow metal.
Rate cut pause priced in
The metal’s drop from Septembre highs above $1550 to $1440 in November indicates the market has priced in Fed’s rate cut pause. On a quarter-to-date basis, gold is currently up just 0.34%.
Fed’s balance sheet expansion
Federal Reserve's balance sheet may hit record highs above $4.516 trillion in May 2020 if the rapid pace of expansion witnessed over the last 3.5 months sustains, according to the popular investor and analyst Charlie Bilello.
The central bank started buying treasuries in mid-September in order to calm money markets and has expanded its balance sheet by more than $330 billion since September. At press time, balance sheet is at $4.10 trillion.
Historically, Fed’s balance sheet expansion programs (QE 1, QE 2 and QE 3) have put a strong bid under the yellow metal. For instance, the Fed began expanding its balance sheet in 2009, when the balance sheet was below $1 trillion. By 2014, it had increased to $4.5 trillion.
During that time frame, gold rose from $800 to $1200, having peaked at a record high of $1921 in September 2011. The pullback from record highs to $1200 was mainly due to Fed taper tantrum.
Major central banks out of ammo
The likes of Bank of Japan (BOJ), European Central Bank (ECB) and Swiss National Bank (SNB) are running negative interest rate policy and seem to have run out of ammo.
For example, the BOJ is running its QE program for the seventh straight years and now owns a major chunk of the ETF market. Even so, inflation remains miles away from the target of 2 percent.
So, there is growing fear in the market that these central banks would be mere spectators during the next bout of recession. At the most, they can cut rates further into negative territory, making the zero-yielding yellow metal more attractive.
There is already a large amount of negative-yielding debt around the world, which creates a favorable backdrop for gold.
What’s more, rates are on a downward trajectory in Australia and New Zealand and also in south-east Asian countries.
Further, the current bull market in US equities that started in March 2009 is the longest on record. The magnitude of the rally is looking increasingly unreal and could force investors to diversify into gold.
Potential headwinds
Trade optimism
The US and China recently agreed to phase one of the most difficult bilateral economic negotiations.
Under the phase one deal, the US will halve the 15% penalty tariff on $300 billion of China imports imposed in September and has canceled bigger rounds of tariffs, which were set to take effect this month.
Many believe the phase-one deal is heavy on the window dressing and does not address contentious issues such as intellectual property theft, state subsidies and support for industrial initiatives.
That said, with the election due in November 2020, President Trump has a strong reason to strike a comprehensive deal, as said by Ethan Harris, head of global economics at BoAML. Even if there is no comprehensive deal, there will at least be a cease-fire ahead of the election.
Put simply, the odds of risk assets putting on a good show and weakening demand for gold in 2020 are high.
Global growth rebound
The IMF and other forecasters expect 2020 to be better than in 2019. Markets are also expecting growth to rebound in 2020. Copper, which is correlated to global growth prospects, has risen by 13 percent since bottoming out at $2.47 per pound in early September. Government bond yields, a good indicator of economic optimism, have also risen across the globe.
The recently released macro data does indicate the slide in the global economy is coming to an end, but there are no signs of recovery gaining traction. Further, investor enthusiasm is often overblown and tends to run ahead of itself.
Not to forget, hard Brexit is still on the table and could rock the equity markets, sending gold higher. All in all, the odds appear stacked in favor of gold bulls. Dips, if any, due to trade optimism will likely be short-lived.
Monthly chart
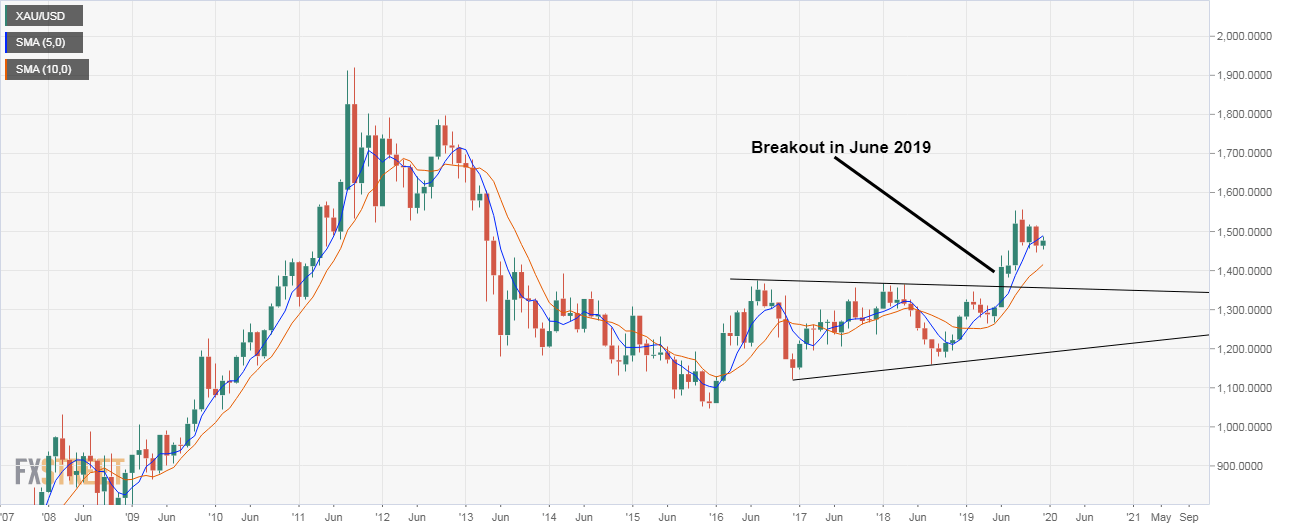
Gold jumped nearly 8 percent in June, confirming a bullish breakout from the three-year-long sideways channel. The 5- and 10-month averages are trending north, indicating strong upward momentum.
The bullish case would be invalidated if and when prices find acceptance under the 10-month MA, currently at $1414.
Weekly chart
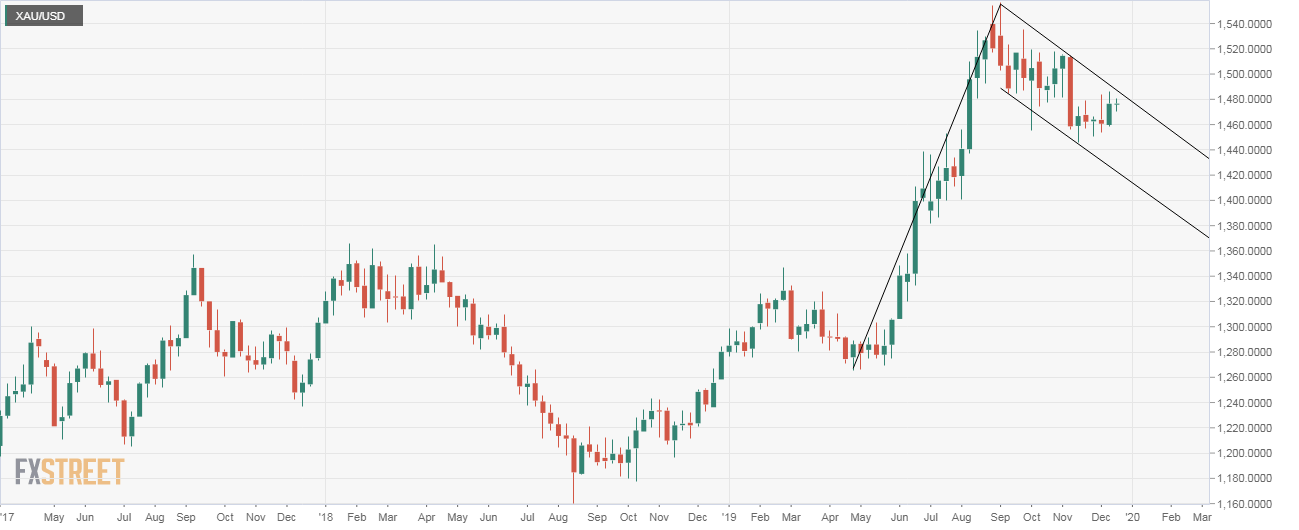
Gold has formed a classic bull flag pattern – a pause that usually refreshes the preceding bull move.
A breakout looks likely and would imply a continuation of the rally from lows near $1265 in April and open the doors to $1,850 (target as per the measured move method).
On the way higher, gold will likely encounter resistance at the September 2019 high of $1557 and $1600 (psychological resistance).
If prices find acceptance under the November low of $1445, then a deeper pullback to $1400-$1300 could be seen.
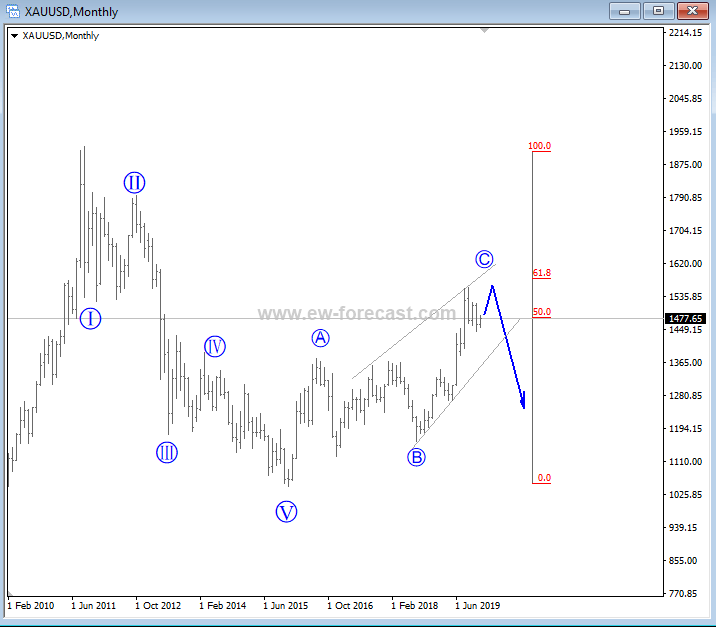
Gregor Horvat sees potential bearish action when conducting his Elliott Wave counts:
Gold Elliot Wave Analysis

Gold made a sharp and impulsive move up in 2019, which was seen out of a wave B consolidation. The move was strong but it's probably part of a corrective recovery if we respect a five-wave sell-off from 2011 highs. However, current recovery extends a little bit higher, but then it may find resistance in the 1st quarter or half of 2020, ideally around 61,8% Fibonacci retracement level, near 1600 area. That being said, be careful with Gold, because the market may see a strong sell-off in the second half of 2020, based on our Elliott Wave look.
Forecast Poll 2020
| Forecast | H1 - Jun 30th | H2 - Dec 31st |
|---|---|---|
| Bullish | 33.3% | 50.0% |
| Bearish | 4.2% | 16.7% |
| Sideways | 62.5% | 33.3% |
| Average Forecast Price | 1527.86 | 1600.67 |
| EXPERTS | H1 - Jun 30th | H2 - Dec 31st |
|---|---|---|
| Alexander Douedari | 1600 Bullish | 1700 Bullish |
| Andrew Lockwood | 1400 Sideways | 1350 Bearish |
| Brad Alexander | 1380 Sideways | 1300 Bearish |
| Chris Svorcik | 2000 Bullish | 2300 Bullish |
| Chris Weston | 1600 Bullish | 1800 Bullish |
| Christina Parthenidou | 1400 Sideways | 1550 Sideways |
| Cypher Asset | 1370 Sideways | 1560 Sideways |
| Dmitriy Gurkovskiy | 1400 Sideways | 1500 Sideways |
| Dukascopy Bank Team | 1630 Bullish | 1550 Sideways |
| Eagle FX Team | 1425 Sideways | 1660 Bullish |
| ForexGDP Team | 1550 Sideways | 1630 Bullish |
| FX Trading Revolution Team | 1550 Sideways | 1500 Sideways |
| Gregor Horvat | 1400 Sideways | 1100 Bearish |
| Ipek Ozkardeskaya | 1430 Sideways | 1400 Sideways |
| Jamie Saettele | 1600 Bullish | 1800 Bullish |
| Jeff Langin | 1480 Sideways | 1550 Sideways |
| Jose Blasco | 1550 Sideways | 1600 Bullish |
| Justin Paolini | 1600 Bullish | 1800 Bullish |
| LMAX Exchange Team | 1700 Bullish | 2000 Bullish |
| Nenad Kerkez | 1568 Sideways | 1366 Bearish |
| OctaFx Analyst Team | 1360 Bearish | 1500 Sideways |
| Stelios Kontogoulas | 1550 Sideways | 1650 Bullish |
| Stephen Innes | 1550 Sideways | 1600 Bullish |
| Tomasz Wisniewski | 1600 Bullish | 1650 Bullish |
We still have to watch how real rates track as a core input for gold, but for much of 2019 gold tracked the global pool of negative yielding bond yields, where at one point more than 30% of all outstanding global govt. debt commanded a negative yield - that figure now sits closer to 20%. Gold has broken from that correlation and we look for the next clear reasoning as to why we should hold gold as a core portfolio hedge against the madness we see in the world. We know there will be new themes and higher vol periods in 2020 and gold, along with JPY and duration assets, will be there to offer variance in the portfolio to offset more risk-friendly assets
by Chris Weston
The XAU/USD pair has been on an upward trend since October 2015, where it had reached a low of 1046. The pair hit a high of 1556 in 2019. In 2020, the pair will be affected by several factors. First, the dovish Federal Reserve could lead to a weaker dollar and a higher gold price. Second, the uncertainties of the upcoming US election could see gold price move higher. Third, weak corporate earnings from the US could raise the likelihood of a corporate recession. This tends to be positive for gold price. On the other hand, a trade deal between the US and China would be negative for gold. The potential scenario is where the XAU/USD pair retests the 38.2% Fibonacci Retracement level of 1360 by June. It could then end the year at 1500.
Related 2020 Forecast Articles
EUR/USD: Lean times soon to turn into flush times for euro dollar
GBP/USD: Pound may continue to fall on hard Brexit deadline
USD/JPY: A journey from trade fears to high-stakes elections
AUD/USD: May the aussie live in interesting times
USD/CAD: Canada and loonie are well positioned but not in control
Crude Oil: WTI bulls to hold their horses despite tighter market, rosier economy
USD/INR: Domestic factors barely support a turnaround for Indian rupee
Bitcoin: BTC, the ultimate store of value
Ethereum: Calm on ETH/USD after the storm is over
Ripple's XRP: The glimpse of hope
Author

Omkar Godbole
FXStreet Contributor
Omkar Godbole, editor and analyst, joined FXStreet after four years as a research analyst at several Indian brokerage companies.


