Top 3 Price Prediction Bitcoin, Ethereum, Ripple: Bitcoin retests its key support level around $62,000
- Bitcoin price retests its 50% retracement level at $62,736, impending rally eyed.
- Ethereum price finds stability around the daily support level of $3,076, with potential recovery on the cards.
- Ripple finds resistance around the $0.643 level; a breakout of this level could signal a bullish move.

Bitcoin (BTC) and Ethereum (ETH) are currently retesting key support levels around $62,700 and $3,000, respectively, suggesting a potential for recovery, while Ripple is finding resistance at $0.640, and a breakout above this level could signal a bullish move in the near future.
Bitcoin price shows potential for a rally ahead after finding support at key level
Bitcoin price faced resistance around the weekly resistance level at $67,209 earlier this week. At the time of writing, BTC extended the correction move for the third day in a row and bounced off on the fourth day after finding support around the 50% Fibonacci retracement level (plotted from the June 7 high of $71,997 to the July 5 low of $53,475) at $62,736.As of Friday, it trades slightly higher 1% at $66,450.
If BTC continues to rise and break above the weekly resistance at $67,209, it could rise by 7% to retest its June 7 high of $71,997.
On the daily chart, the Relative Strength Index (RSI) and the Awesome Oscillator (AO) indicators are trading above their neutral levels of 50 and zero, respectively. This robust momentum signals a strong bullish sentiment in the market.
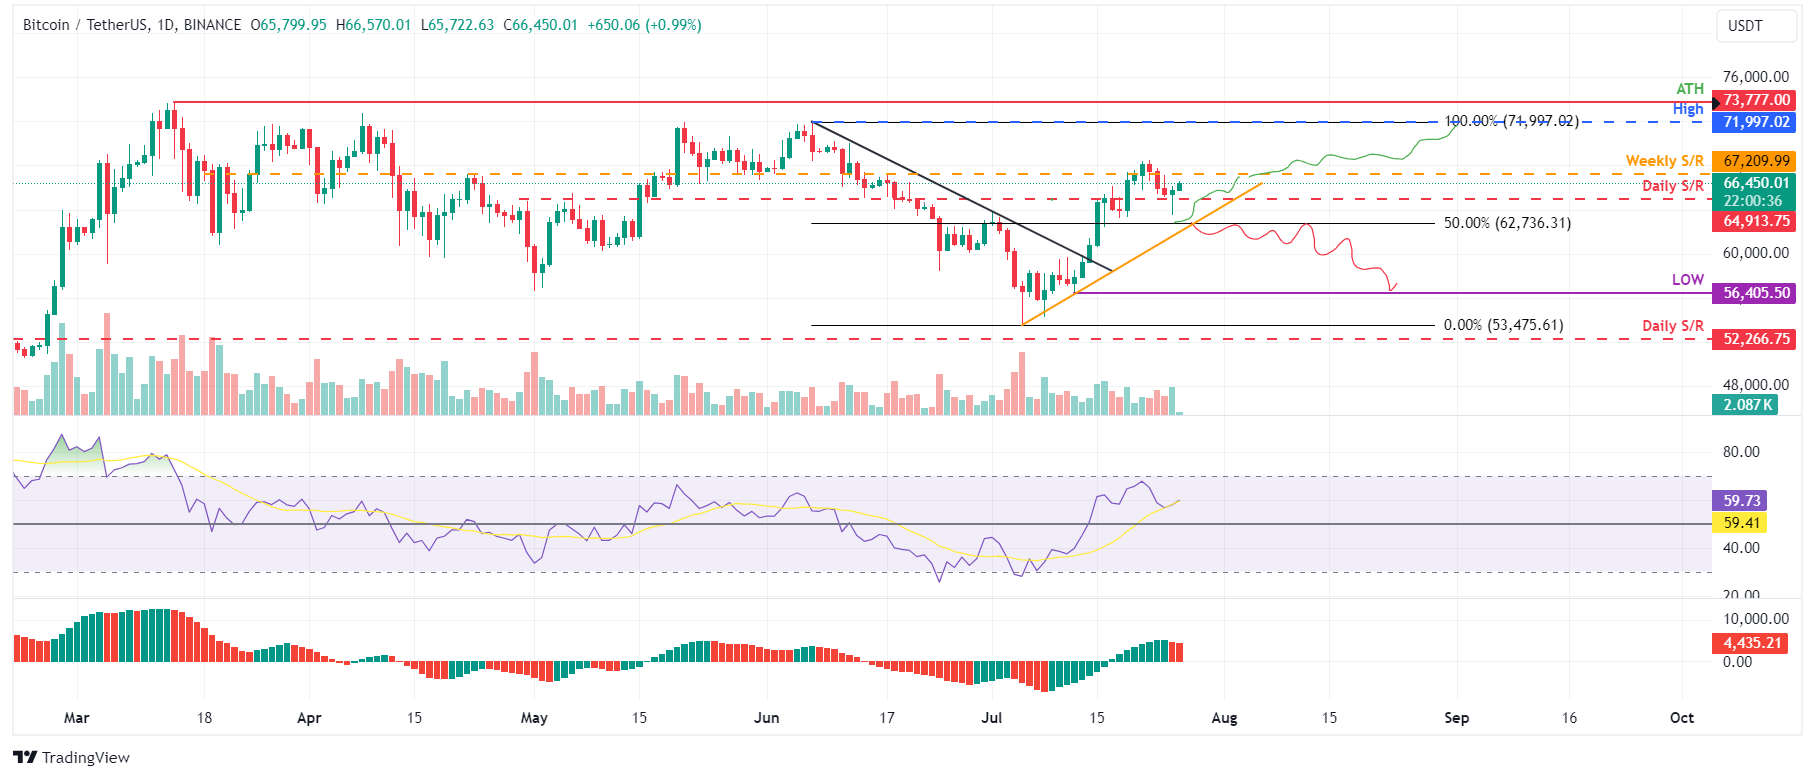
BTC/USDT daily chart
However, a close below $62,736 and a break below the ascending trendline would change the market structure from bullish to bearish by forming a lower low on the daily timeframe. Such a scenario might precipitate a 10% crash in Bitcoin's price to retest its July 12 low of $56,405.
Ethereum price poised for a rally after retesting the trendline support area
Ethereum price faced resistance at $3,530 earlier this week, aligning with the 61.8% Fibonacci retracement level from the May 27 high of $3,977 to the July 5 low of $2,808. It extended its correction for the fourth consecutive day. As of the latest update, it is testing the former trendline resistance—now acting as support—at $3,076 and is currently trading 0.58% higher at $3,194.
If this level at $3,076 holds, ETH could rally 15% to retest its 61.8% Fibonacci retracement level at $3,530.
The Relative Strength Index (RSI) on the daily chart has briefly slipped below the neutral level of 50, while the Awesome Oscillator (AO) is on its way to doing the same. If bulls are indeed making a comeback, then both momentum indicators must maintain their positions above their respective mean levels. Such a development would add a tailwind to the recovery rally.
If bullish sentiment prevails and the overall cryptocurrency market outlook remains optimistic, Ethereum price could close above the $3,530 mark, potentially continuing its rally by 5.3% to challenge its June 9 daily peak of $3,721.
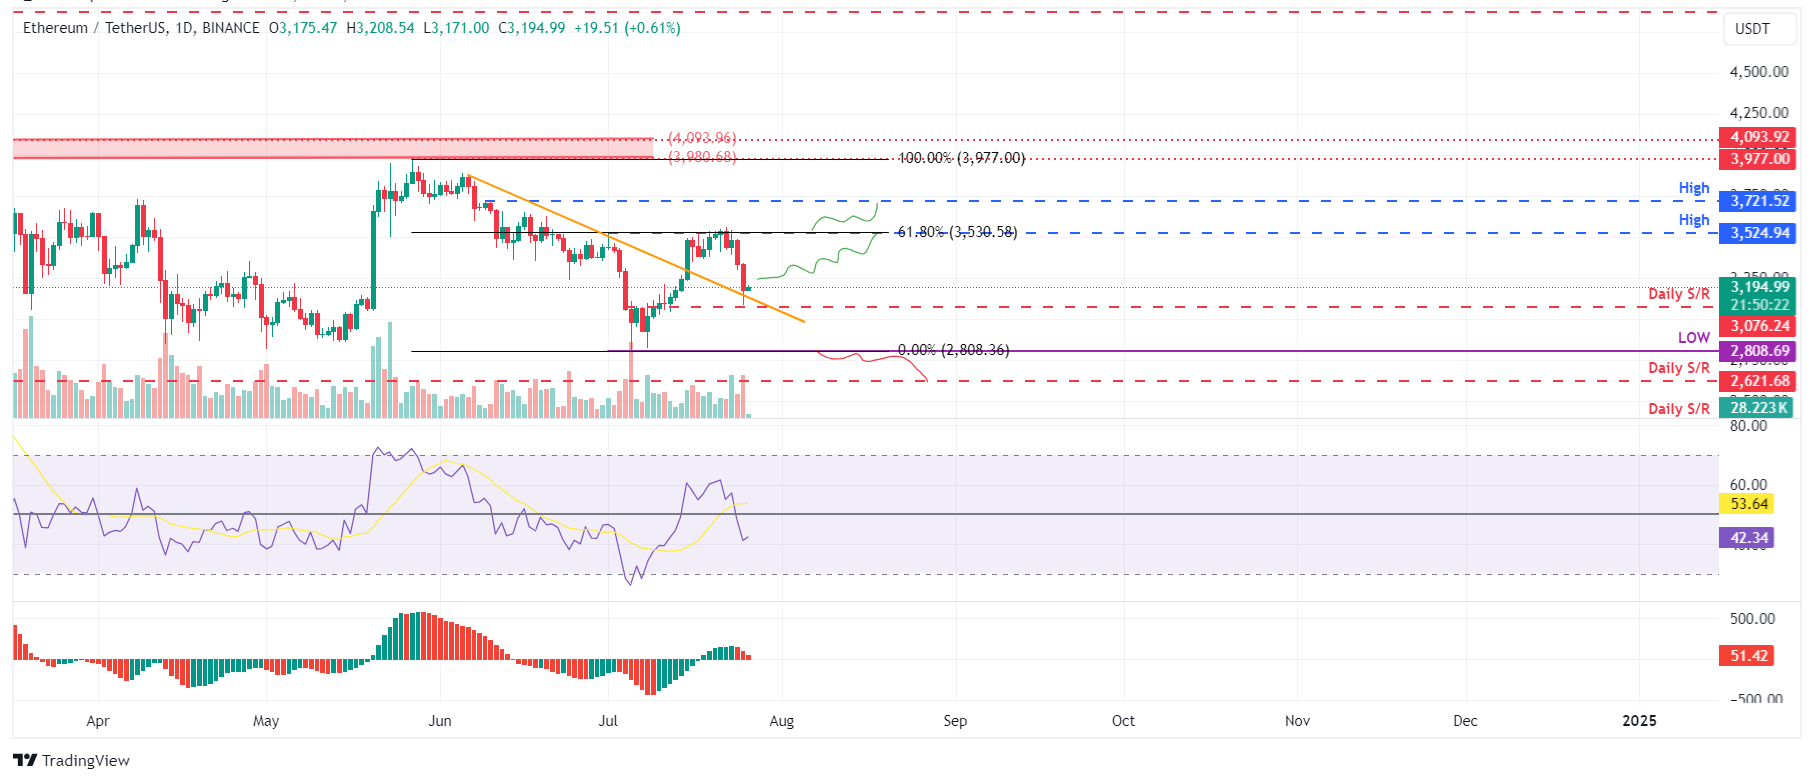
ETH/USDT daily chart
On the other hand, if Ethereum's daily candlestick closes below $2,817, forming a lower low in the daily timeframe, it may signal persistent bearish sentiment. This scenario could trigger a 7% decline in Ethereum's price, targeting a revisit of its daily support at $2,621.
Ripple price shows potential for a rally following a close above the $0.643 mark
Ripple price faced rejection at around $0.643 on July 17 and crashed 8.8% the next two days.XRP retested its daily support at $0.544 and rallied 5% earlier this week. As of Friday, it trades slightly higher, 0.53%, reaching $0.603.
If XRP closes above the $0.643 level, it could rally 13.3% to retest its next daily resistance level at $0.724.
On the daily chart, the Relative Strength Index (RSI) and the Awesome Oscillator (AO) are currently above their neutral levels of 50 and zero, respectively. These momentum indicators strongly indicate bullish dominance.
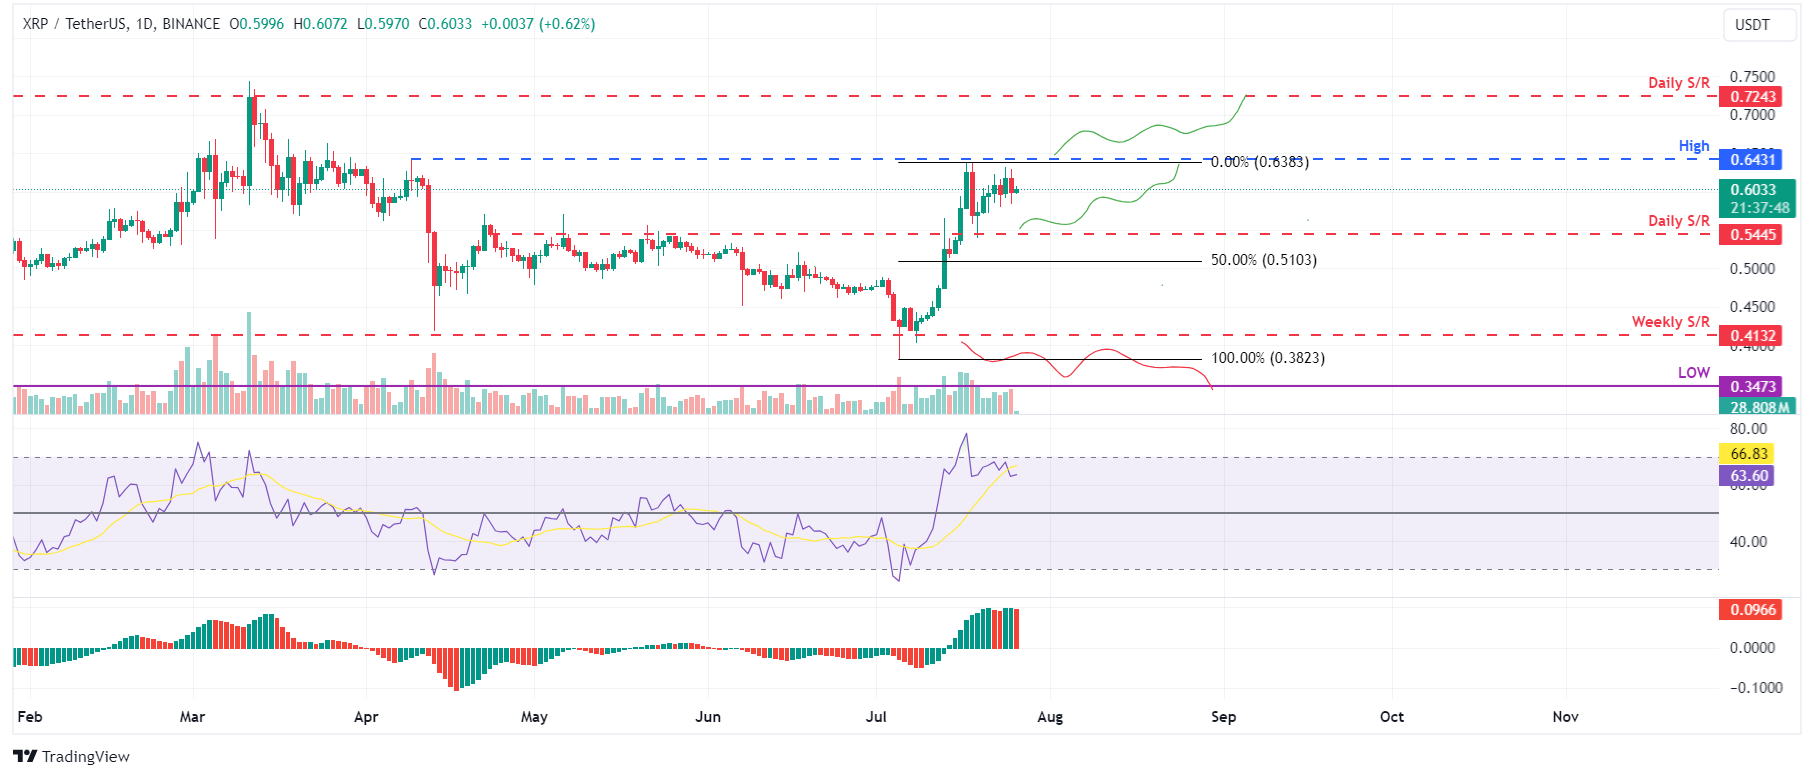
XRP/USDT daily chart
However, if Ripple's daily candlestick closes below $0.413, it indicates sustained bearish sentiment, forming a lower low in the daily timeframe. Such a scenario could lead to a 16% decline in Ripple's price, targeting a revisit of its low from March 12 at $0.347.
Author

Manish Chhetri
FXStreet
Manish Chhetri is a crypto specialist with over four years of experience in the cryptocurrency industry.


